Australia, imports olive oil and table olives
Australia's imports of olive oil and olive-pomace oil increased by 7% in the 2017/18 crop year. Spain and Italy are main suppliers: accounting for 89.9% of the total...

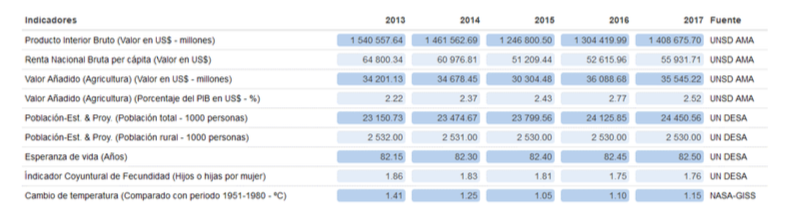
Australia has a total area of 7 741 220 km2, an estimated 35 000 of which has been devoted to olive growing. The Gross Added Value of agriculture represents 2.52% of GDP. The population stands at 24 450 561 people, 10.35% of which live in rural areas. Life expectancy is 82.5 years and the number of children per woman is 1.76.
Olive oil and olive-pomace oil
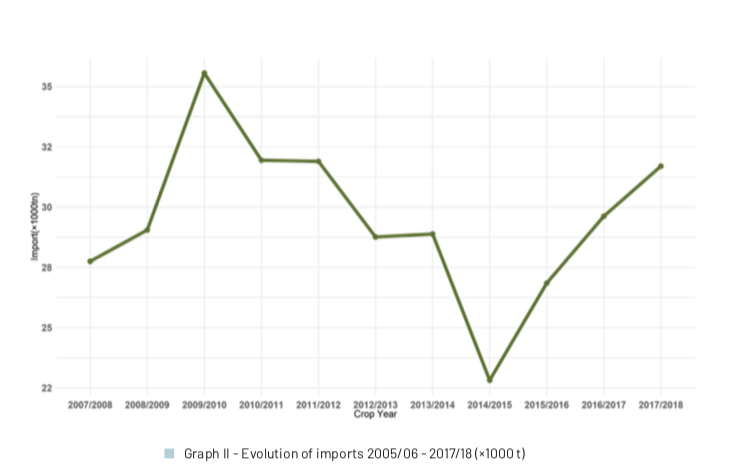
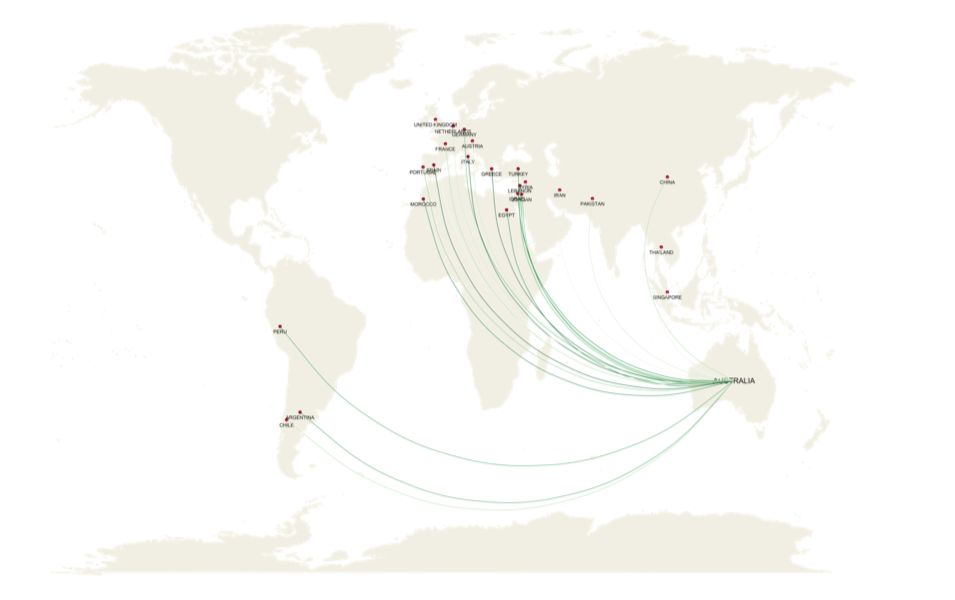
Australia’s imports of olive oil and olive-pomace oil increased by 7% in the 2017/18 crop year. Some 31 699 t were imported, an increase of 10.2% if we compare with the 2012/13 crop year, which saw imports of 28 762 t. Table I shows changes in imports over the last 6 crop years: the minimum was reached in the 2014/2015 crop year, coinciding with the year with the lowest gross national income per capita (2015). On the other hand, Spain and Italy are Australia’s main suppliers, accounting for 89.9% of the total, followed by Greece with 4.4% and the rest of the countries with less than 2%. The largest increases in the 2017/18 crop year oc-curred in Lebanon and Spain (47.7% and 12.7%, respectively) compared to the previous crop year. In sectionI.1 of this publication you can follow the monthly movements of this market.
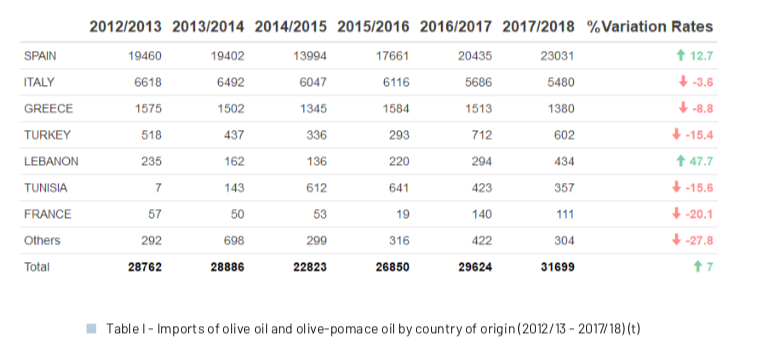
By origin of imports, 94.6% of the total came from the European Union. The remaining 5.4% comes mainly from Turkey 1.9%, Lebanon 1.4% and Tunisia 1.1%.
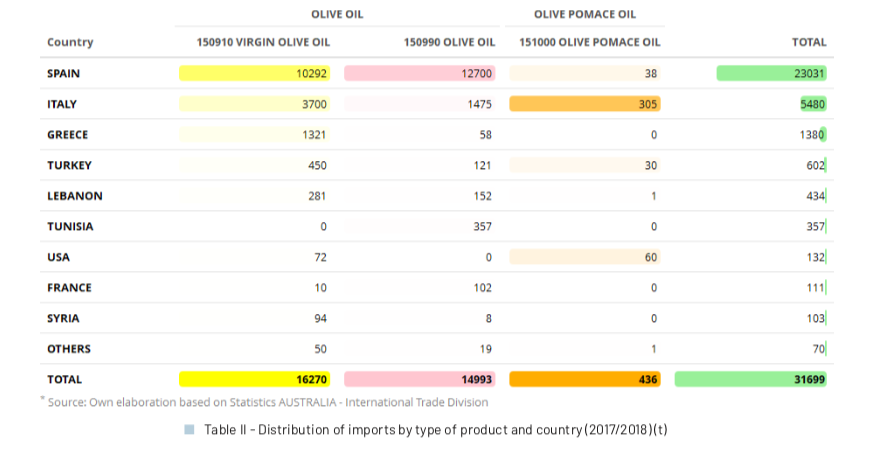
As for volumes by product category, 51.3% of total imports were under code 15.09.10 (virgin olive oils), fol-lowed by imports corresponding to code 15.09.90 (olive oils) with 47.3% and the remaining 1.4% correspon-ding to imports under code 15.10.00 (olive-pomace oils).
Trends in imports of virgin olive oils and olive oils have changed since the 2014/2015 crop year. Imports of vir-gin olive oils increased by 27.5% if we compare the 2017/2018 crop year with the 2007/2008 crop year, when they represented 46% of total imports.
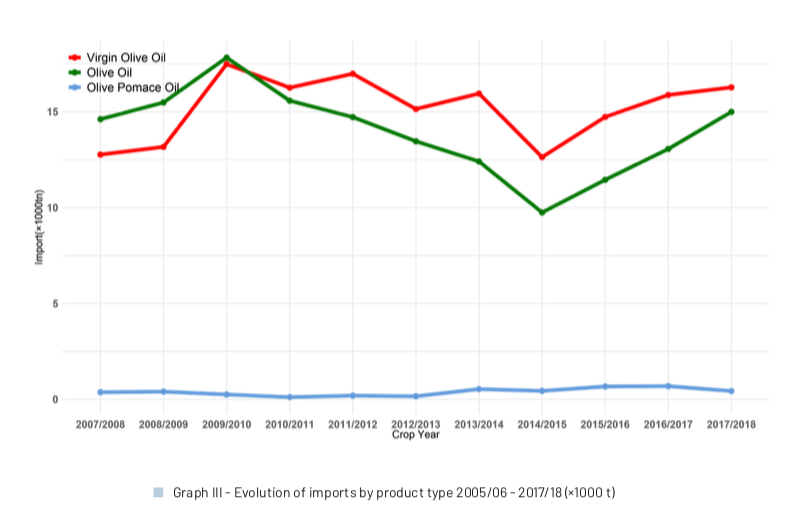
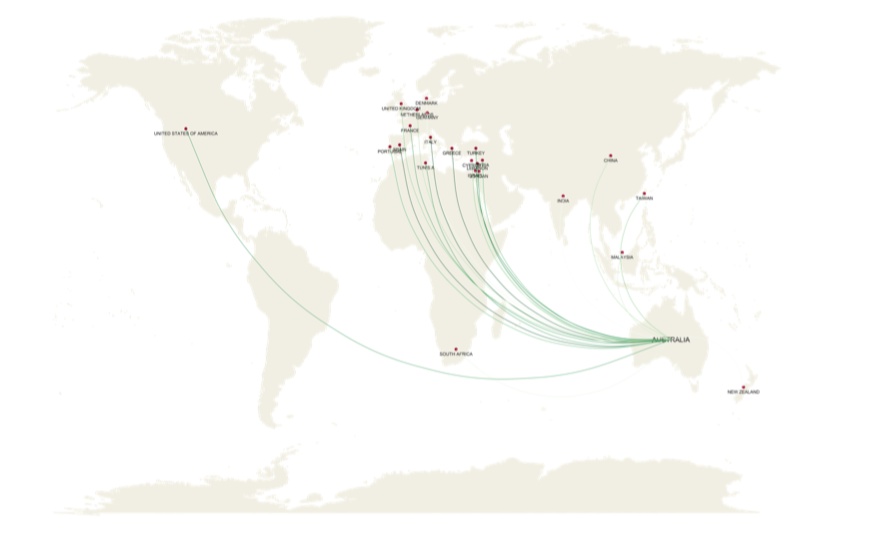
Table olives
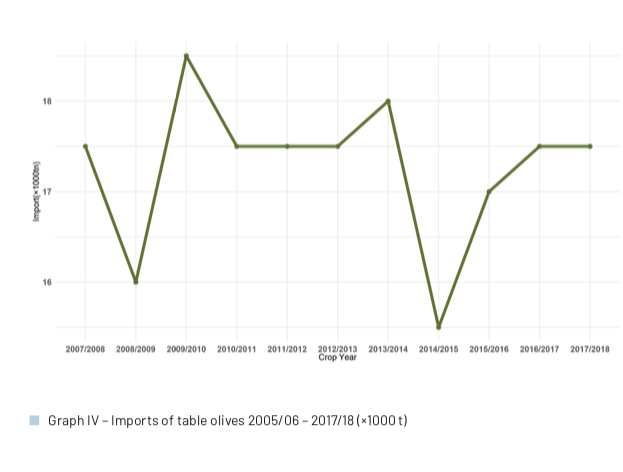
Australian has imported around 17 000 t of table olives in the last 11 crop years, reaching 17 259.9 t in the 2017/18 crop year (September 2017 – August 2018), or 2.7% of world imports.
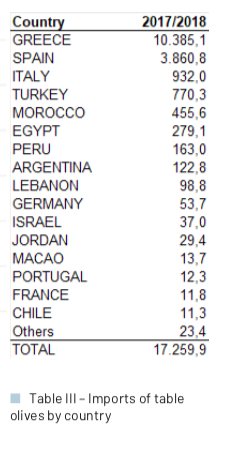
Table II shows the imports of the last crop year by country of origin. Greece stands out as the main supplierto Australia, with 60.2% of the imported volume (10 385.1 t), followed by Spain with 22.4% (3 860.8 t) and Turkey with 4.5% (770.3 t). The rest of the countries are below 3%. In section I.2 of this publication you canfollow the monthly movements of this market.

To comment you have to register
If you're already registered you can click here to access your account
or click here to create a new account
Comment this news