Brazil. Imports of olive oil and table olives
Over the last ten crop years the trend in imports per product category has altered considerably. Currently, 87% of imported oil is of the virgin or extra virgin olive oil category, 12% is olive oil and only 1% is olive pomace oil.

Olive oil and olive-pomace oil
Although Brazilian olive oil and olive-pomace oil imports have risen by 19% year-on-year over the 2016/17 crop year, at 60 139.9 t, they have not reached the average volumes of the last four crop years. As regards the provenance of imports, 84% of the total comes from European countries: 57% from Portugal, followed by Spain with 20%, Italy with 6% and Greece with 1%; the remaining 16% comes from Argentina (9%), Chile (6%) and other countries (1%).
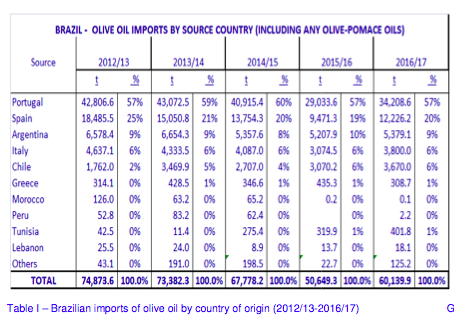
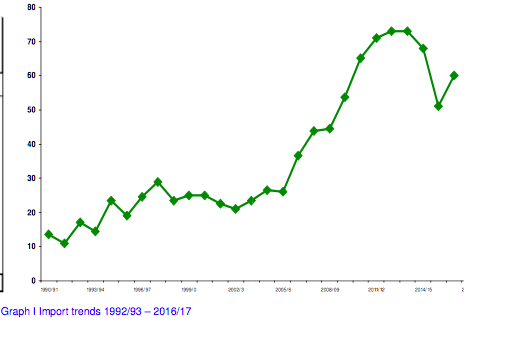
Table 1 shows import trends over the last five crop years. It shows how Portugal, which is the first exporter to Brazil, maintains its leading position in this market in both absolute and relative terms. Over the period reported in Table I, imports decrease by 14 734 t (-24%). This decline is attributed to the economic crisis and the devaluation of the Brazilian currency; following the increase in the last crop year, however, everything is pointing to a recovery. Graph 1 presents the development of Brazilian imports over more than 20 crop years, observing a constant increase that reached its maximum point in the 2012/13 crop year. The monthly movements of this market are shown in Section I.1.
Over the last ten crop years (Graph II) the trend in imports per product category has altered considerably. In the 2006/07 crop year, imports of virgin olive oil and olive oil were practically level (48% and 47%, respectively), while imports of olive pomace oil stood at 5%. Currently, 87% of imported oil is of the virgin or extra virgin olive oil category, 12% is olive oil and only 1% is olive pomace oil.
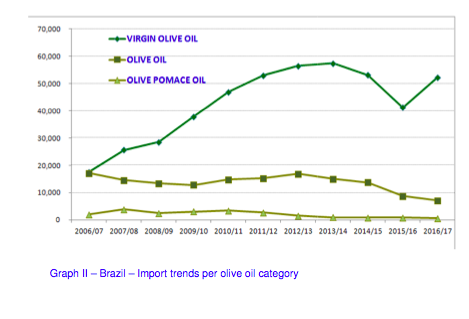
Table olives
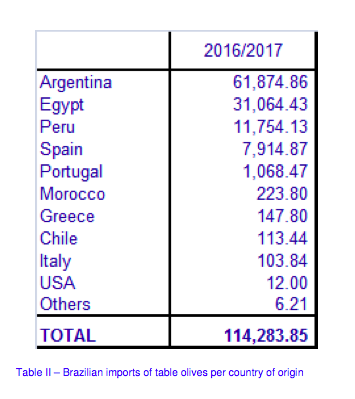
The Brazilian table olive market performed well in the 2016/17 crop year (September 2016 – August 2017) reaching 114 283.85 t which is an 18% increase compared to the previous year. Graph III shows that imports over the last 20 crop years have gone from 4 6849.7 t in 1996/97 to 114 283.85 t in 2016/17, resulting in a 144% increase.
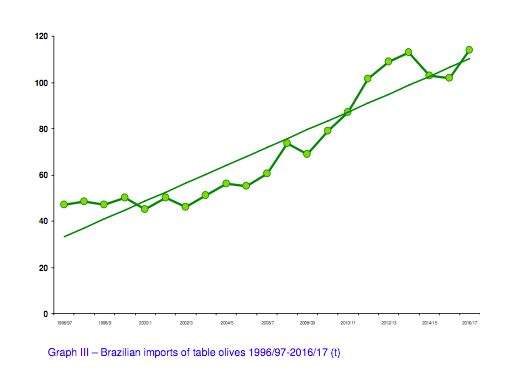
Table II shows the imports of the last crop year per country of origin. Argentina is the largest provider in this market with 54% of the volume of imports (61 874.86 t), followed by Egypt with 27% (31 064.43 t); Peru with 10% (11 754.13 t), Spain with 7% (7 914.87 t) and Portugal with 1% (1 068.47 t). Section I.2 shows the monthly movements of this market.

To comment you have to register
If you're already registered you can click here to access your account
or click here to create a new account
Comment this news