Canada, imports olive oil and table olives
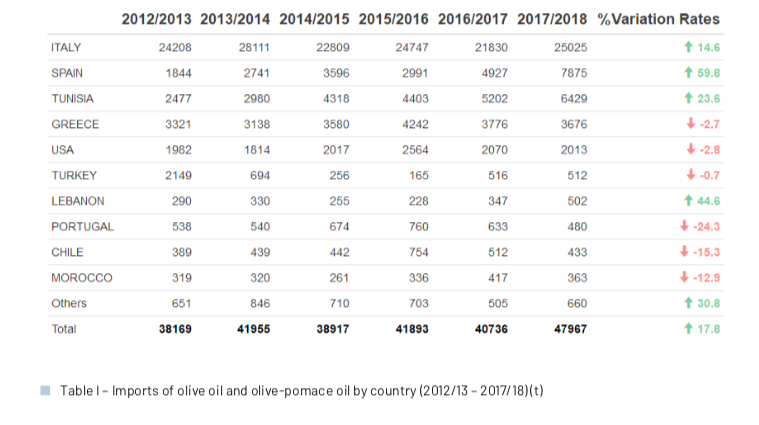
Canada accounts for about 5% of world imports of olive oil and olive-pomace oil. Imports reached 47 967 tin the 2017/18 crop year, an increase of 17.8% compared to the previous year, but an increase of 25.7% if wecompare to the 2012/13 crop year, when Canada imported 38 169 t

Olive oil and olive-pomace oil. Table I shows changes in imports overthe last 6 crop years. The three main suppliers to Canada are Italy, with just over half of total imports, Spain and Tunisia , accounting for 82% of all imports, followed by Greece with 7.7% and the United States with 4.2%. The greatest increases in the 2017/18 crop year were found in Spain (59.8%), Lebanon (44.6%), Tunisia (23.6%) and Italy (14.6%) compared to the previous crop year. Monthly price movements can be found in section I.1 of this newsl.
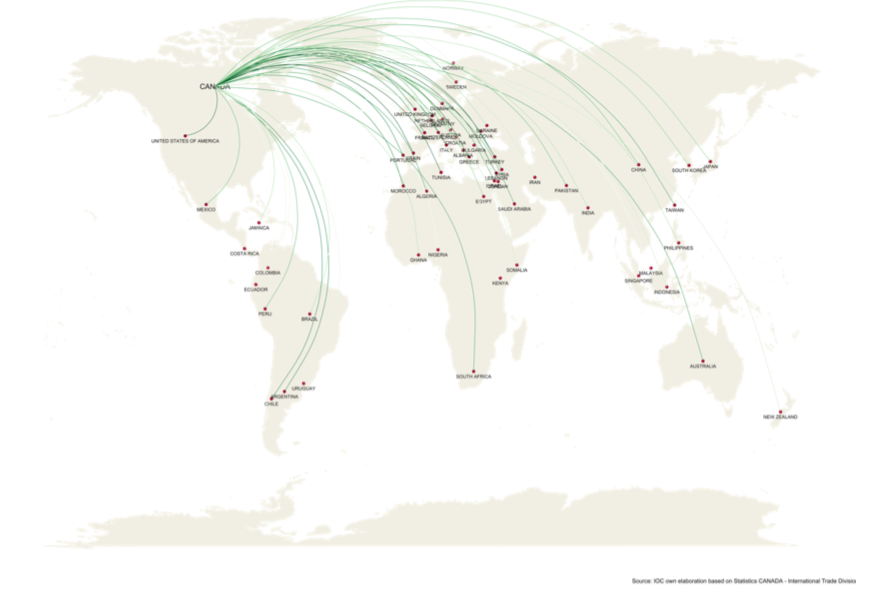
By origin, around 77.3% of imports came from the European Union. The remainder came mainly from Tunisia (13.4%), the United States (4.2%), Turkey (1.1%) and Lebanon (1%).
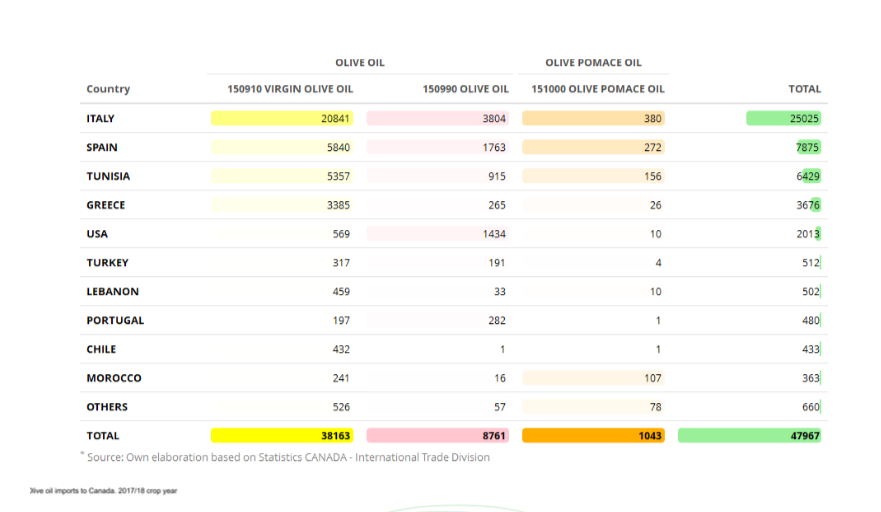
As for volumes by product, 79.6% of imports fell under code 15.09.10 (virgin olive oils), followed by imports under code 15.09.90 (olive oils) with 18.3% and the remaining 2.1% corresponding to imports under code 15.10.00 (olive-pomace oils).
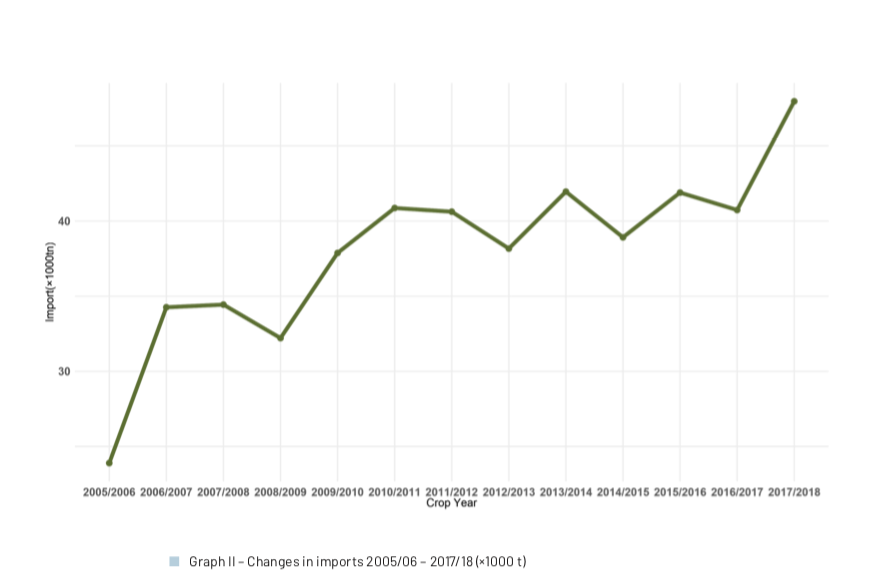
Overall, imports of virgin olive oils have been ticking upwards. The total volume imported has increased by 132.1% if we compare the 2017/2018 crop year with the 2005/2006 crop year, when they accounted for 68.8% of all imports.
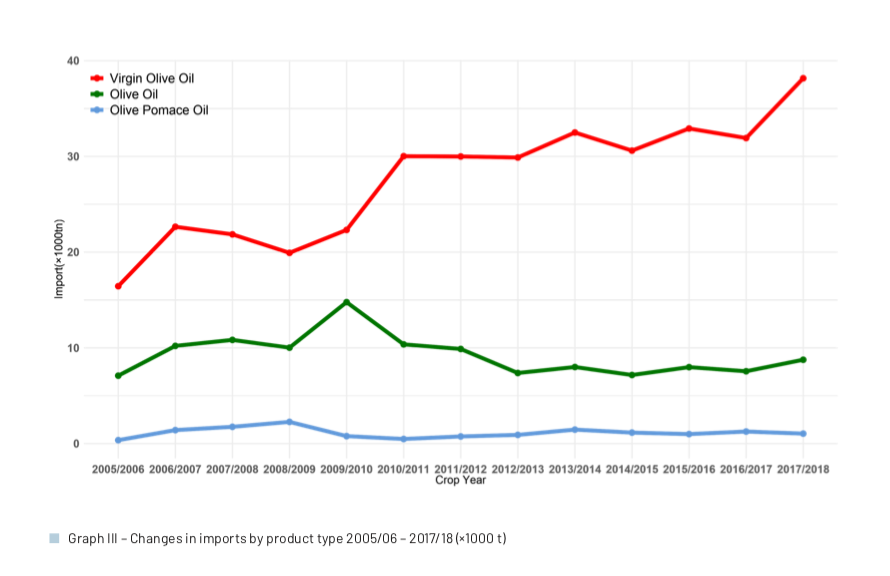
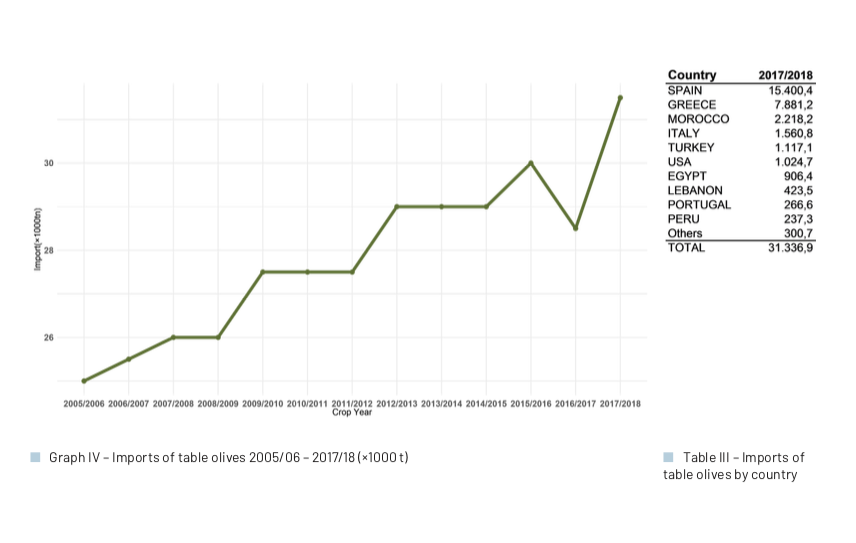
Table olives. Canadian market for table olives has shown overall long-term growth, reaching 31 336.9 t in the 2017/18 crop year (September 2017 – August 2018), or 4.8% of world imports, an increase of 9.3% compared to theprevious crop year. Graph IV shows the trend in imports over the last 13 crop years, from 20 007.9 t in 2005/06to 31 336.9 t in 2017/18, an increase of 56.6%.
Table II shows imports in the last crop year by country of origin. Spain stands out as the main supplier, pro- ducing 49.1% of all imports (15 400.4 t); followed by Greece with 25.1% (7 881.2 t); Morocco with 7.1% (2 218.2 t) and Italy with 5.0% (1 560.8 t). The rest of the countries are below 5%. Monthly price movements can be found in section I.2 of this news.

To comment you have to register
If you're already registered you can click here to access your account
or click here to create a new account
Comment this news