Trends in global consumption of table olives
The global consumption of table olives in recent years has multiplied by 2.7, increasing by 182.0% over the period 1990/91–2016/17
Graph 1 illustrates this trend, where the largest increase in consumption is seen in the main IOC member producers. Production in some of these countries has increased markedly, as a result of consumption. Egypt is one such case, and which has gone from consuming 11 000 t in 1990/91 to 400 000 t in 2016/17.
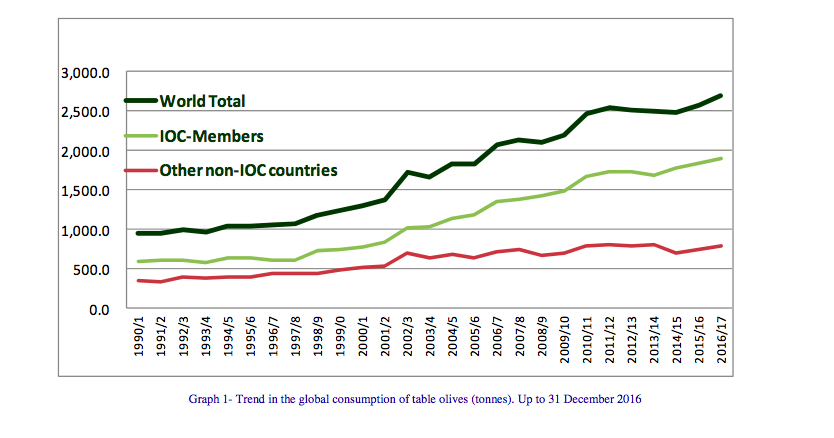
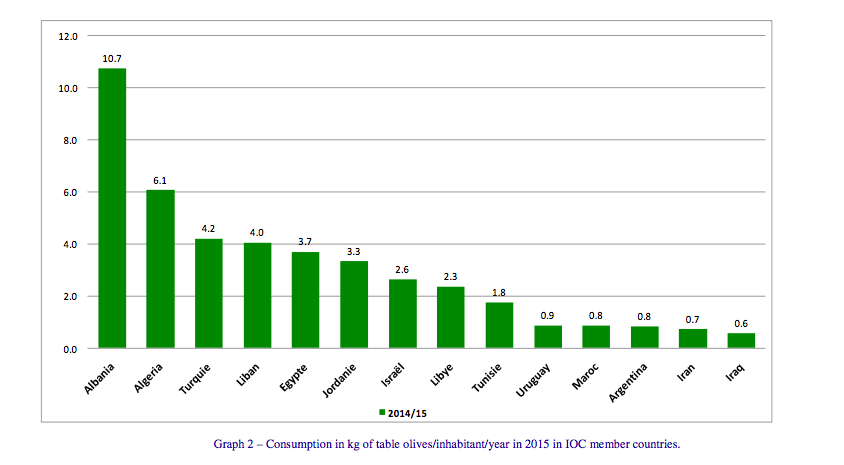
In this same period Algeria went from consuming 14 000 to 244 000 t and Turkey from 110 000 to 350 000 t. The other countries have also seen increases, although these have been proportionally lower. Graph 2 shows the annual consumption of table olives per inhabitant in IOC member countries in 2015, with Albania in the lead with a consumption of 10.7kg/inhabitant/year. It should be noted that Albania has a total consumption of 31 000 t, and it has a population of less 2 889 000 inhabitants. It is followed by Algeria with 6.1 kg, Turkey and Lebanon oscillate between 4.2 and 4.0 kg; Egypt and Jordan report 3.7 kg and 3.3 kg respectively; Israel and Libya 2.6 kg and 2.3 kg and Tunisia 1.8 kg. Consumption is shared out among the other countries within a scale of 0.9 kg to 0.6 kg of table olives a year (in decreasing order: Uruguay, Morocco, Argentina, Iran and Iraq).
As part of the activities provided for in the International Agreement and its standardisation mandate, the IOC is responsible for drawing up and revising trade standards. In the case of the trade standard applying to table olives, it lays down definitions and provisions relating to the different commercial categories of table olives. Its work also includes revising the Codex Alimentarius standard for this product, with a view to regulating the quality criteria in international trade.
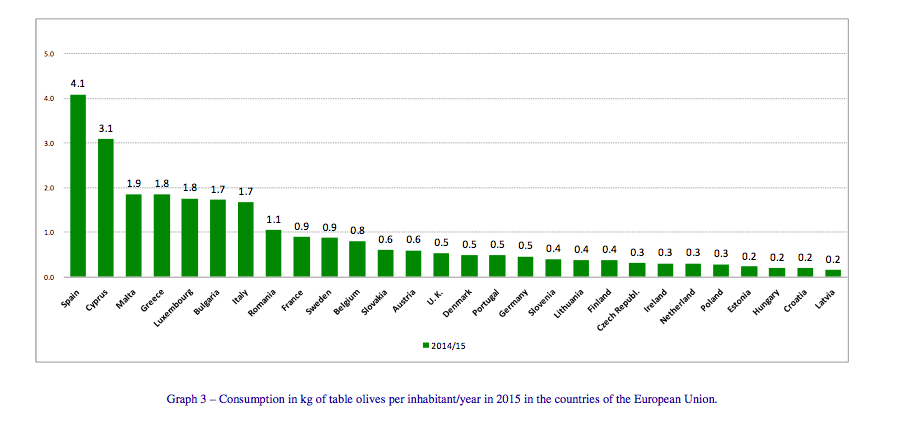
Consumption in the countries of the European Union has increased over this period by 78.4%, going from 346 500 t in 1990/91 to 618 000 t in 2016/17. Graph 3, which tracks the consumption of table olives per inhabitant and year, identifies Spain, which is the main producer, as the main consumer with 4.1 kg, followed by Cyprus with 3.1 kg, Malta with 1.9kg, Greece and Luxembourg with 1.8 kg each, Bulgaria and Italy both post 1.7 kg and Romania 1.1 kg. In decreasing order, consumption in France, Sweden Belgium, Slovakia, Austria, the United Kingdom and Denmark lies between 0.9 and 0.5 kg. Consumption in other countries of the European Union (Slovenia, Lithuania, Finland, Czech Republic, Ireland, the Netherlands, Poland, Estonia, Hungary, Croatia and Latvia) stands between 0.4 and 0.2 kg.
Microsoft Word – NEWSLETTER- JANUARY-2017-ENGLISH
Graph 4 tracks the consumption of table olives per inhabitant and year in the group of countries that are not members of the IOC. Syria is the first consumer in this group of countries with 5kg/inhabitant/year, followed by Palestine and Chile, which oscillate between 2.5 kg and 2.1 kg. Peru and Saudi Arabia report between 1.3 kg and 1.1 kg; they are followed by Australia, Canada and Switzerland with 0.8 kg each; the United States and Brazil have consumptions of 0.6 kg and 0.5 kg respectively, and Russia and Mexico each report a consumption of 0.2 kg.
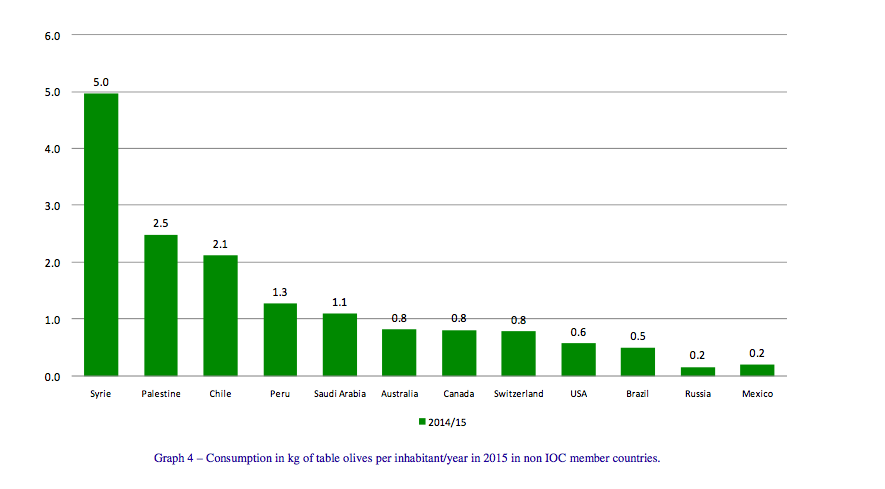
Photo by Olio Officina

To comment you have to register
If you're already registered you can click here to access your account
or click here to create a new account
Comment this news