Trends in US olive oil imports: bulk and packaged
Over the last two decades, US imports of olive oil and olive pomace oil have increased almost two and a half times, rising from 125 000 t in 1993/94 to 311 000 t in 2014/15
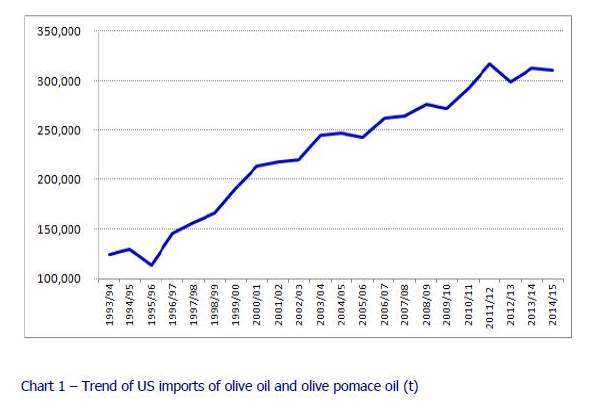
In this month’s issue we will look at how imports have evolved over time in terms of the grades of olive oil imported and container type.
In 1993/94, product packaged in containers
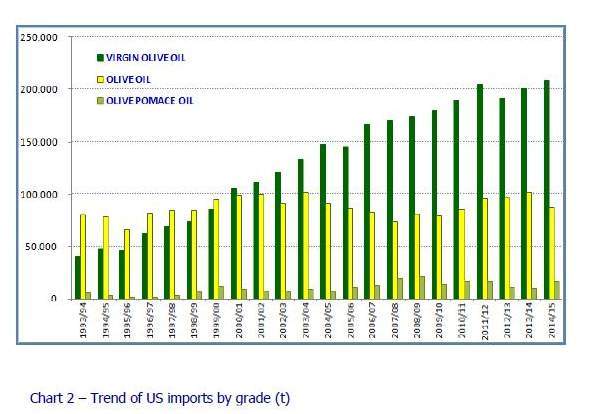
In 2014/15, when US imports totalled more than 311 000 t, the trend had reversed and more olive oil was being imported in bulk than in bottles. Since 2000/01 there has also been a move towards quality among US consumers. This is shown by the fact that in 1993/94 virgin olive oil had a 32 pc share of total imports. In 2014/15 this share had expanded to 67 pc (Chart 2).
As mentioned above, 58.2 pc of the oil imported into the United States in 2014/15 was in containers
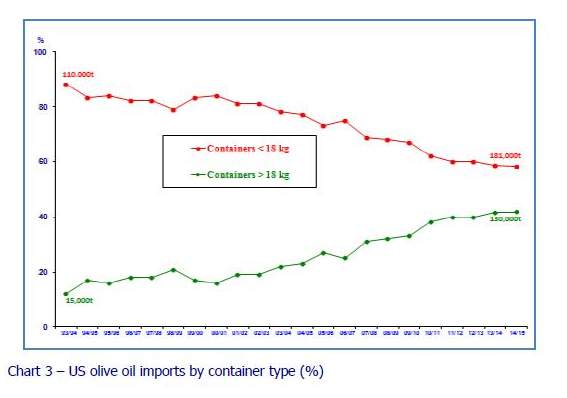
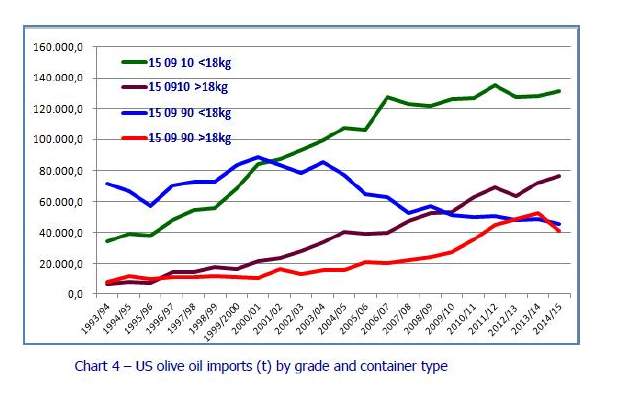
As can be seen from Chart 3, bulk-container imports have been winning ground from packaged product over the last 20 years. Italy leads the packaged market while Spain dominates the bulk market. In 2014/15, almost 42 pc of the olive imported into the United States was in containers > 18 kg, of which 19 pc was from Spain, followed by Tunisia (13 pc), Morocco (3 pc), Argentina (2 pc), Italy (1.6 pc), Chile (1.5 pc) and the rest of the countries. Virgin olive oil was the most popular grade for imports in this category of container (24 pc of the total, of which 17 pc extra virgin, 5 pc organic extra virgin and 2 pc virgin). Thirteen per cent belonged to the olive oil grade and 4 pc was olive pomace oil. Chart 4 plots the trend of US imports of the two chief categories of product – virgin olive oil (150910) and olive oil (150990) – by container size over the past 20 crop years. Notably, until 2001/02, packaged olive oil was in greatest demand (150990
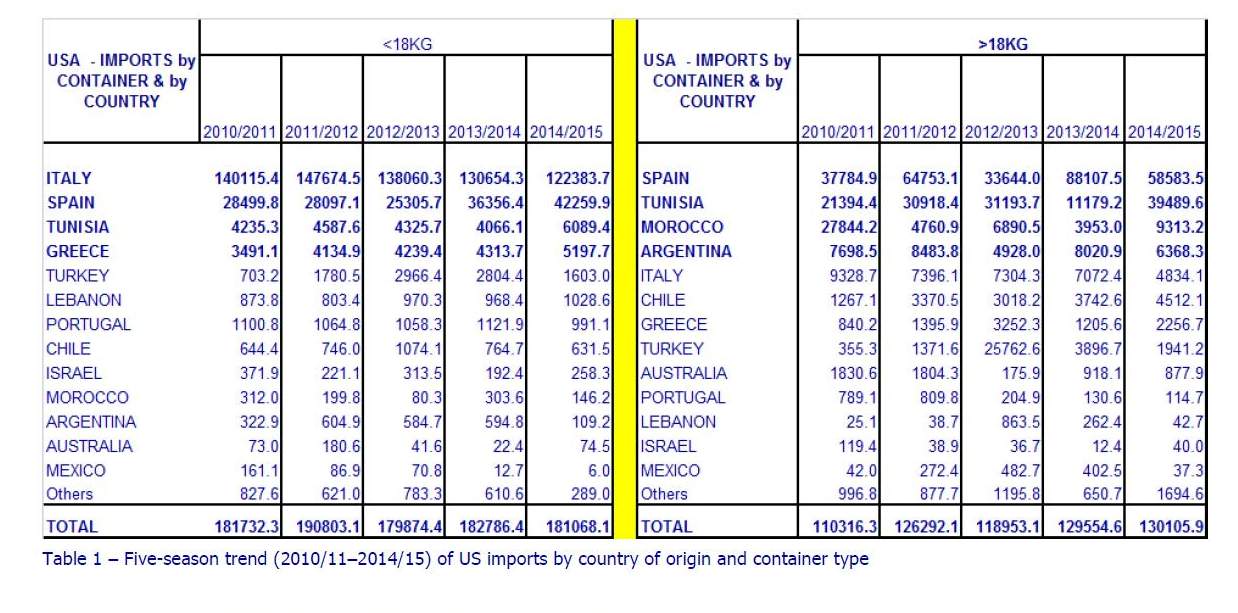
The five-season trend of US imports by country of origin and container size between 2010/11 and 2014/15 is reported in Table 1. The picture that emerges is a 17.9 pc increase in bulk imports, contrasting with a loss in bottled shared (−0.41 pc). The four top suppliers of packaged product by order of volume are Italy, then Spain, Tunisia, Greece and Turkey. In the bulk ranking, Spain is the leader, followed by Tunisia, Morocco, Argentina and Italy. Spain therefore clearly dominates the bulk market and is making inroads in packaged product, which is still led by Italy although it has lost ground in volume terms over the period reviewed.

To comment you have to register
If you're already registered you can click here to access your account
or click here to create a new account
Comment this news