Producción
OLIVE OIL – 2015/16 – As can be seen in the table below, at the close of the 2015/16 crop year (October 2015 – September 2016) imports of olive oil and olive pomace oil in the eight markets that appear in the table below presented a year-on-year increase of 18% in Australia, 12% in China, 8% in Canada, 7% in the United States and 4% in Russia, whereas they fell in Brazil (-25%) and Japan (-8%).
In the EU1, the 11-month figures for the current crop year (October 2015–August 2016) showed a 6% drop in intra-EU acquisitions and a 56% drop in extra-EU imports compared to the previous crop year.
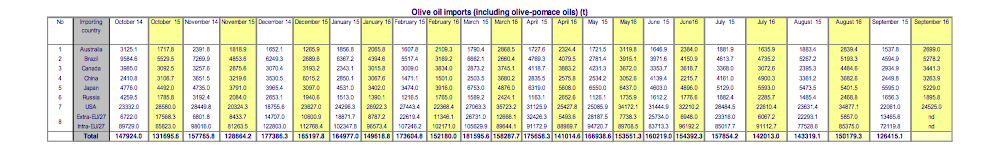
TABLE OLIVES – 2015/16 – At the close of the 2015/16 crop year (October 2015–September 2016) imports in table olives in the six markets that appear in the table below presented a year-on-year increase of 9% in Australia, 3% in Canada and 1% in the United States. Imports however decreased by 1% in Brazil and 3% in Russia.
EU2 data for the first eleven months of the 2015/16 crop year (October 2015 – August 2016) present a year-on-year increase in intra-EU acquisitions of 3% and extra-EU imports of 3%.

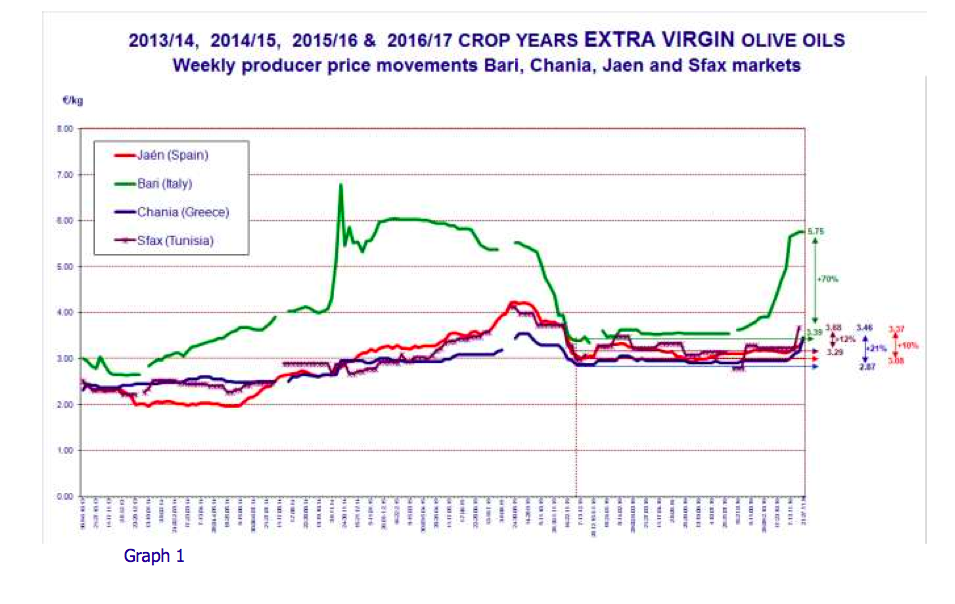
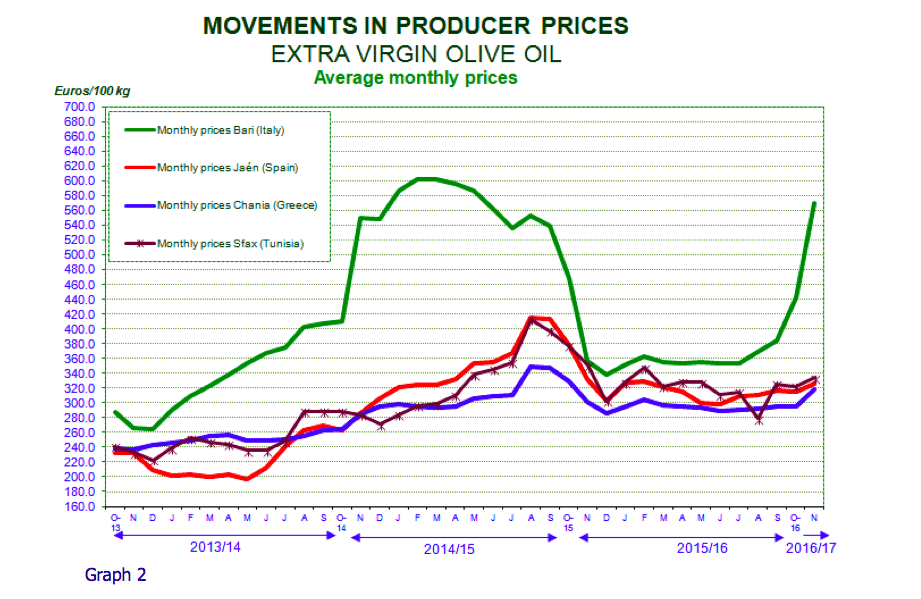
PRODUCER PRICES – OLIVE OILS – Graph 1 tracks the weekly movements in prices paid to producers for extra virgin olive oil in the top three European producing countries and Tunisia, while Graph 3 shows the weekly changes in producer prices for refined olive oil in the main three EU producers. The monthly price movements for these grades of oil are tracked in Graphs 2 and 4.
Extra virgin olive oil – Producer prices in Spain increased at a constant rate over the last few weeks coming in at €3.37/kg at the end of November 2016, which is a 10% year-on-year increase. If we compare this price with the maximum amount for the third week in August 2015 (€4.23/kg) it shows a 20% decrease (Graph 1).
Italy – Producer prices in Italy started to climb at the beginning of August, intensifying at the beginning of November and breaking the €5 barrier at €5.75/kg at the end of November. This is a 70% year-on-year increase. Graph 2 shows how the monthly prices of extra virgin oil behaved in recent crop years.
Greece – Prices in Greece remained stable from mid-August until the beginning of November but, as in other markets, started to climb in recent weeks to come in at €3.46/kg at the end of November 2016, which is a 21% year-on-year increase.
Tunisia – The prices in Tunisia had remained stable over the last few weeks, but then started to climb up to €3.68/kg at the end of November, which is a 12% increase compared to the same period the previous year.
Producción
Refined olive oil: The prices of refined olive oil in Spain and Italy generally follow the same trend as the price of extra virgin olive oil. In Spain, they came in at €3.25/kg, which was a 10% increase on the same period the previous year. However, while prices for virgin oils in Italy rose in recent weeks, refined olive oil remained stable, coming in at €3.21/kg at the end of November, whereby there is no year-on-year change. No price data are available for this product category in Greece.
At the end of November 2016 the price of refined oil (€3.25/kg) and extra virgin oil (€3.37/kg) differed by €0.12/kg. In Italy, the difference in price between the two categories is wider than in Spain at €2.54/kg (Graph 3).

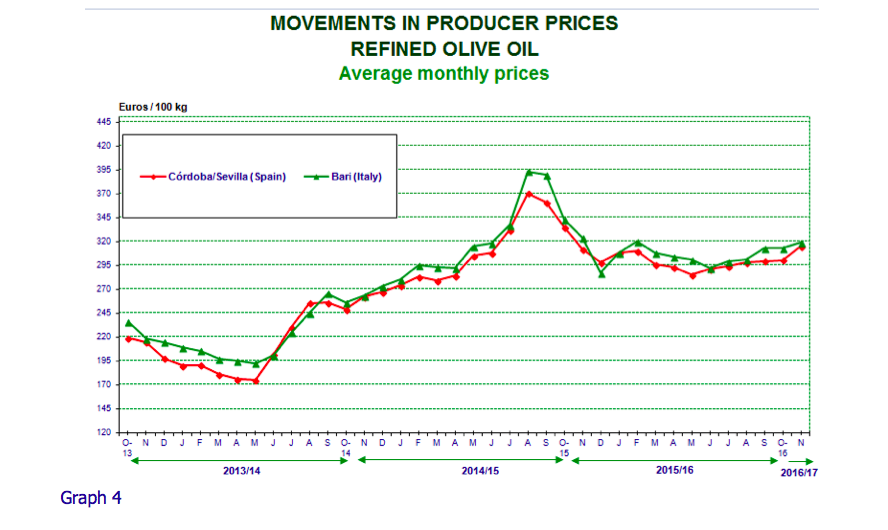
Photo by Luigi Caricato

To comment you have to register
If you're already registered you can click here to access your account
or click here to create a new account
Comment this news