
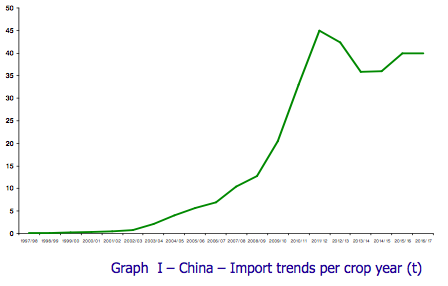
Olive oil and olive pomace oil imports in China increased by 12% over the last crop year. As Graph I indicates, the olive to the respective previous crop years. General stability was maintained in 2014/15 compared to the previous years, rallying to end the 2015/16 crop year with a 12% increase. Over the first 3 months of the current year (2016/17), imports of olive oil have undergone a strong increase of 42% (Graph II). Graph II tracks monthly imports and also shows the largest import volumes in the first months of the campaign (November, December and January), with a marked decrease in February.
As regards the origin of olive oil imports to China, in the 2015/16 crop year, 96% of the total came from countries in the European Union, with Spain in the lead with 81% of the total, followed by Italy with 13% and Greece with 2%. The remaining 4% come from Australia, Tunisia, Morocco, Turkey and Portugal. As regards import volumes per product category, 77% of total imports come under the code 15.09.10 (virgin olive oils), followed by 14% under the code 15.10.00 (olive pomace oils) and 9% under code 15.09.90 (olive oils).
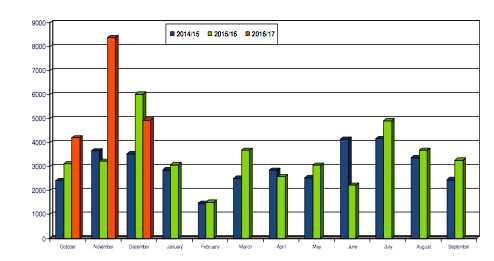
Graph II – China – Monthly import trends of olive oil 2014/15–2016/17 (t)

To comment you have to register
If you're already registered you can click here to access your account
or click here to create a new account
Comment this news