Trends of olive oil and table olives markets according to the latest data disclosed by the International Olive Council

Microsoft Word – ok-NEWSLETTER- OCTOBER-2017-ENGLISH
1. OLIVE OIL – 2016/17
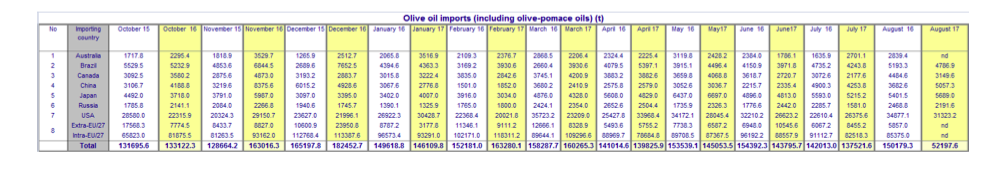
Imports in olive oil and olive pomace oil in the first eleven months of this crop year (October 2016 – August 2017) in the eight markets listed in the table below point to an increase of 21% in Brazil; 13% in China; 2% in Russia; while figures remain stable in Japan. In the United States and in Canada, however, imports decreased by 4% and 2% respectively compared to the previous crop year.
At the time of publishing this Newsletter, the figures for Australia were not available for the month of August but over the first ten months of the year imports grew by 20%.
EU figures (1) for the first ten months of the current crop year (October – July 2017) indicate that intra-EU acquisitions increased by 4% and extra-EU imports decreased by 3% compared to the same period the previous year.
Microsoft Word – ok-NEWSLETTER- OCTOBER-2017-ENGLISH
(1) EU data for August 2017 were not available at the time of writing.
2. TABLE OLIVES – 2016/17
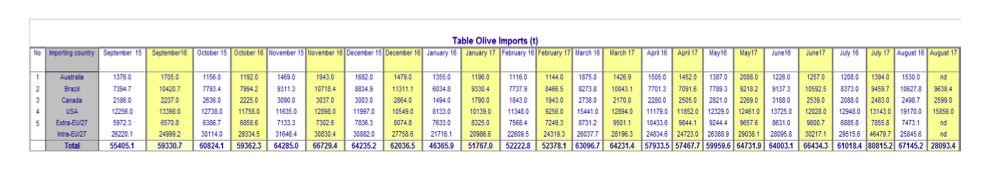
At the close of the 2016/17 crop year (2) (September 2016 – August 2017) imports of table olives had increased by 15% in Brazil. Canada and the United states closed the year on a downturn with a 4% year-on-year decrease in both markets. The data for Australia were not available for the month of August but the first eleven months saw a 6% increase.
EU (3) figures for the first eleven months of the 2016/17 crop year (September 2016 – July 2017) indicate that intra-EU acquisitions increased by 6% while extra-EU imports increased by 5% compared to the previous crop year.
Microsoft Word – ok-NEWSLETTER- OCTOBER-2017-ENGLISH
(2) According to the new provisions of the International Agreement on Olive Oil and Table Olives, 2015, which came into force on 1 January 2017, “table olive crop year” means the period of twelve months from 1 September of one year to 31 August of the next. Under the 2005 Agreement, the crop year for table olives was the same as that for olive oil (October to September).
(3) EU data for August 2017 were not available at the time of writing.
PRODUCER PRICES – OLIVE OIL
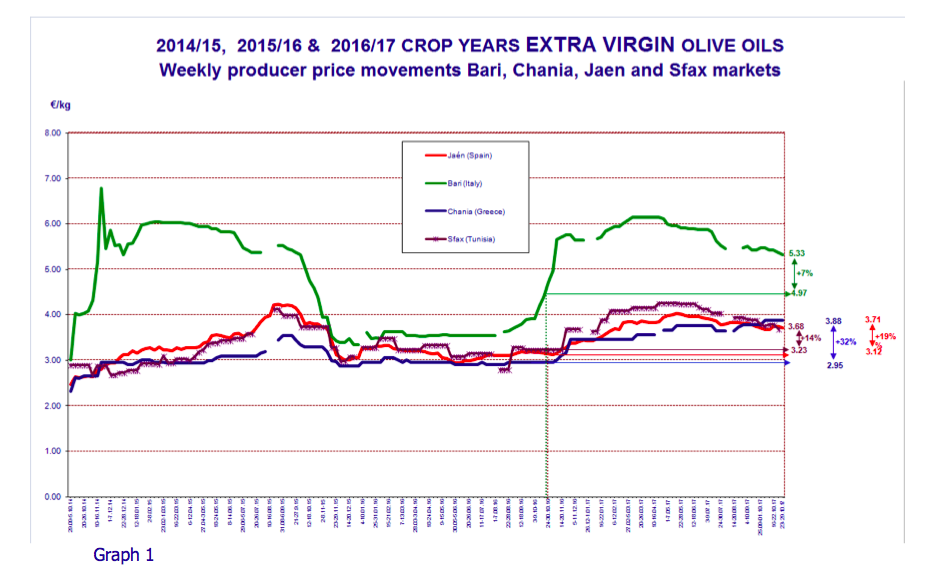
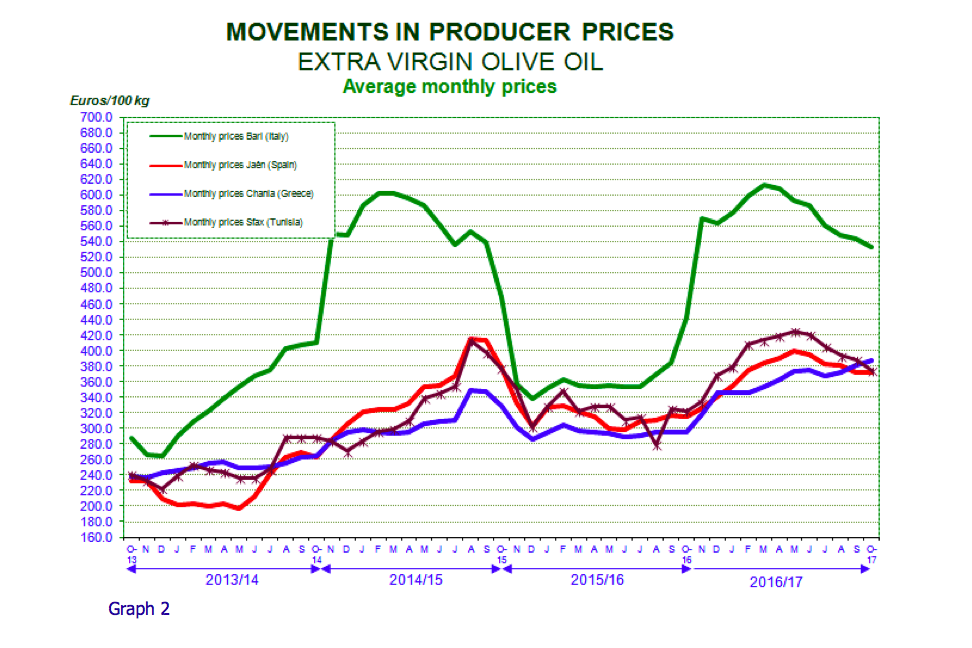
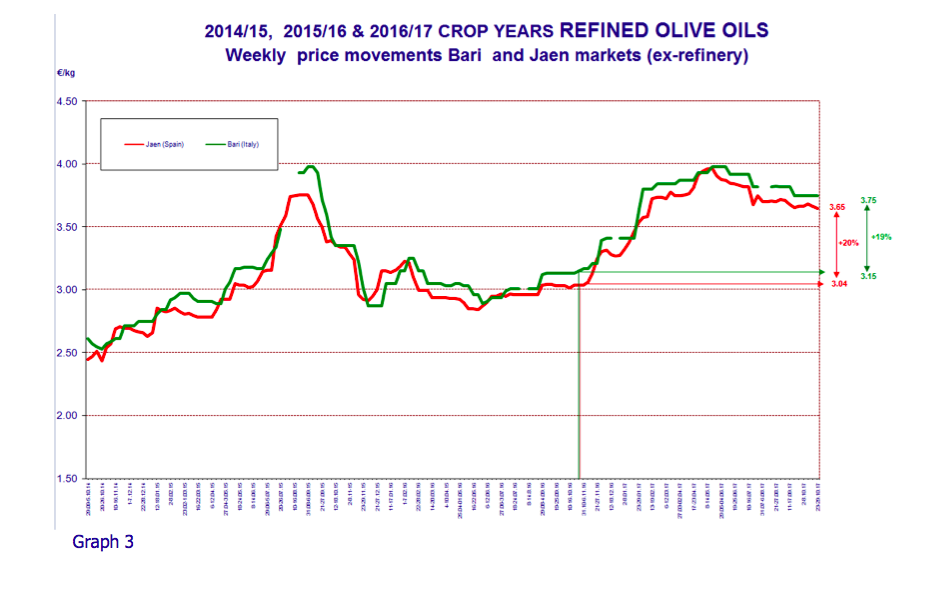
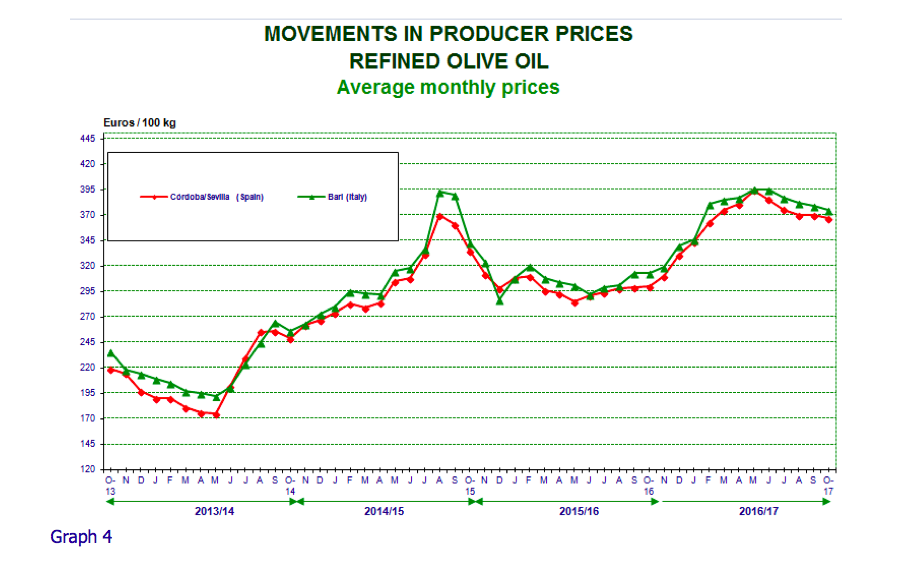
Graph 1 tracks the weekly movements in the prices paid to producers for extra virgin olive oil in the top three EU producing countries and in Tunisia, while graph 3 shows the weekly changes in producer prices for refined olive oil in the three main EU producer countries. Monthly price movements for these categories are given in Graphs 2 and 4.
Extra virgin olive oil – Producer prices in Spain have remained generally stable over the last few weeks, coming in at €3.71/kg at the end of October 2017, which is a 19% increase compared to the same period the previous year (Graph 1).
Italy – Prices in Italy have continued decreasing in recent weeks, coming in at €5.33/kg at the end of October 2017, which is a 7% year-on-year increase. Graph 2 shows the monthly price movements of the extra virgin olive oil category in recent crop years.
Greece – The prices in Greece increased slightly in recent weeks, coming in at €3.88/kg, which is a 32% increase compared to the same period the previous year.
Tunisia – Prices in Tunisia fell in recent weeks coming in at €3.68/kg at the end of October 2017 for a 14% year-on- year increase.
Refined olive oil: Producer prices for refined olive oil in Spain and Italy generally follow the same trend as the prices for extra virgin olive oil. The price in Spain in October 2017 stood at €3.65/kg, up by 20% compared to the same period the previous year. In Italy it reached €3.75/kg, for a 19% year-on-year increase. No price data are available for this product category in Greece.
At the end of October 2017, the price difference in Spain between refined olive oil (€3.65/kg) and extra virgin oil (€3.71/kg) was of €0.06/kg. In Italy, the price difference between the two categories was greater than in Spain at €1.58/kg (Graph 3).
 Microsoft Word – ok-NEWSLETTER- OCTOBER-2017-ENGLISH

To comment you have to register
If you're already registered you can click here to access your account
or click here to create a new account
Comment this news