Australia, olive oil imports
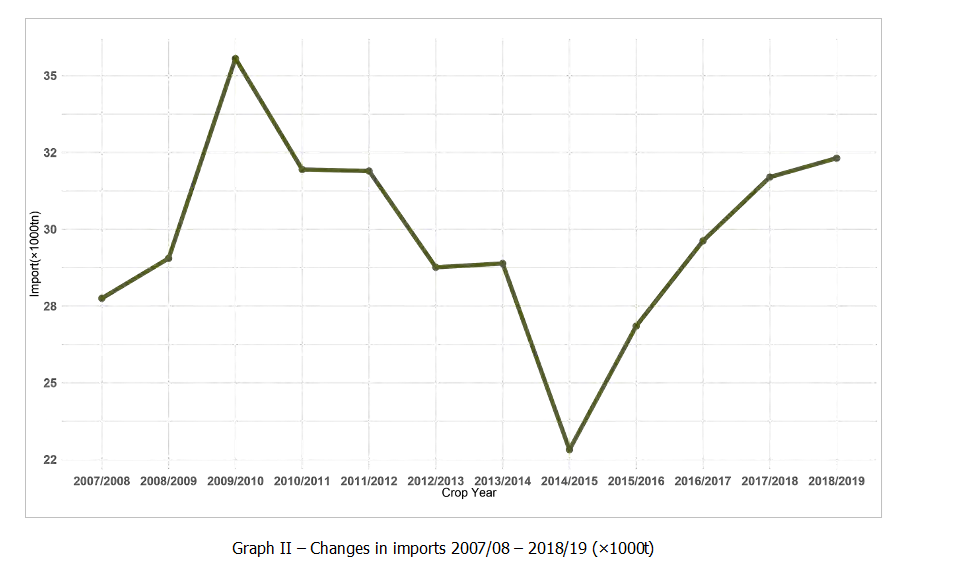
Imports of virgin olive oil and olive oil in Australia increased by 2% in the 2018/19 crop year, reaching 31 897 t, the highest figure in the last 9 crop years.

Olive oil and olive pomace oil
Australia accounts for about 3% of world imports of olive oil and olive pomace oil. Imports increased by 1.9% in the 2018/19 crop year compared to the previous crop year, reaching 32 315 t. However, if we compare with the 2012/13 crop year when it reached 28 762 t, imports have risen by 12.4%.
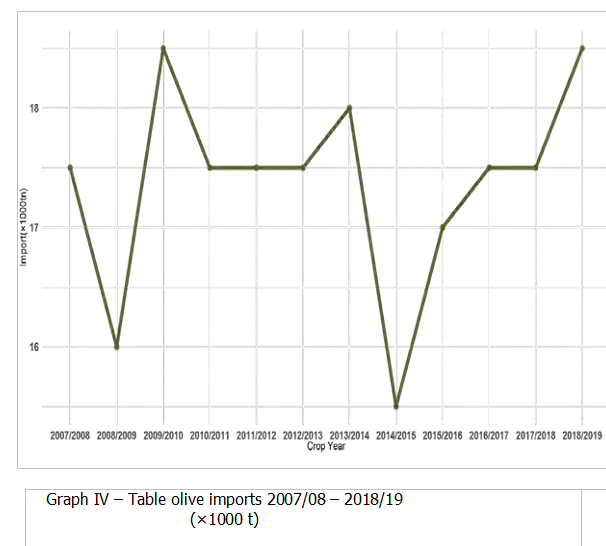
Table I shows changes in imports over the last seven crop years. The minimum was reached in the 2014/2015 crop year, when per capita GNI was at its lowest. The main suppliers to Australia are Spain and Italy, contributing 88.7% of imports, followed by Greece with 3.7% and Turkey with 3.1%. The remaining countries provide under 2%. The greatest increases in the 2018/19 crop year were found in Turkey, Tunisia and Italy (68.2%, 39.5% and 17.7%, respectively).
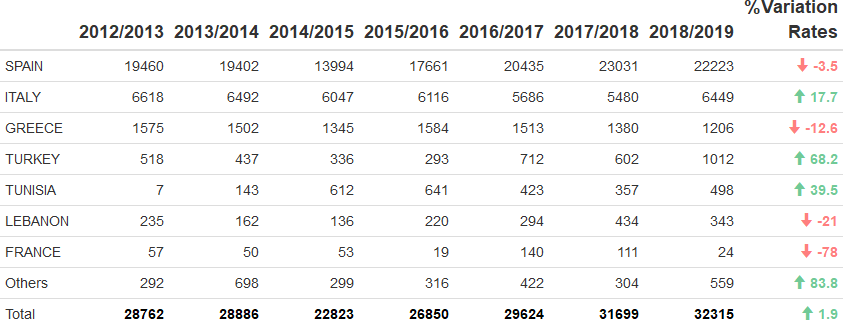
About 92.5% of imports come from the European Union. Most of the remaining 7.5% comes from Turkey (3.1%), Tunisia (1.5%) and Lebanon(1.1%).
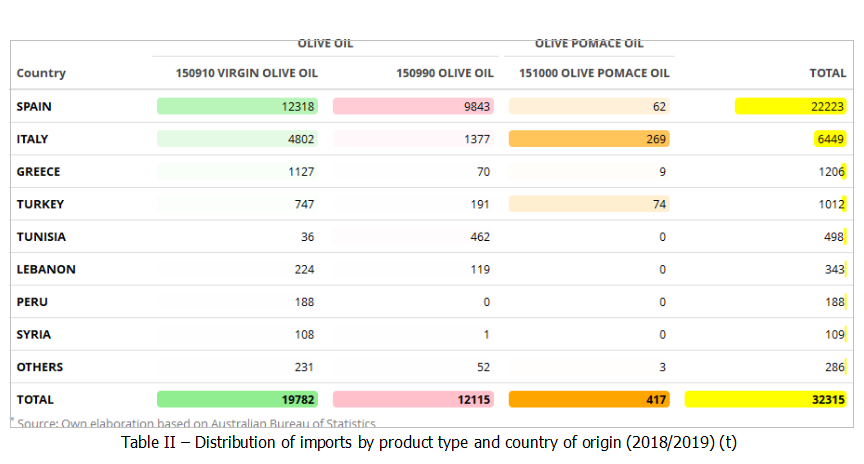
As for volumes by product category, 61.2% of total imports fell under code 15.09.10 (virgin olive oils), followed by imports under code 15.09.90 (olive oils) with 37.5%. The remaining 1.3% corresponds to imports under code (15.10.00) (olive pomace oils).
Trends in virgin olive oil and olive oil imports began to change in the 2014/2015 crop year. If we compare the 2018/2019 crop year with the 2007/2008 crop year, when imports represented 46% of total imports, the total volume of virgin olive oil imports has risen by 55%.
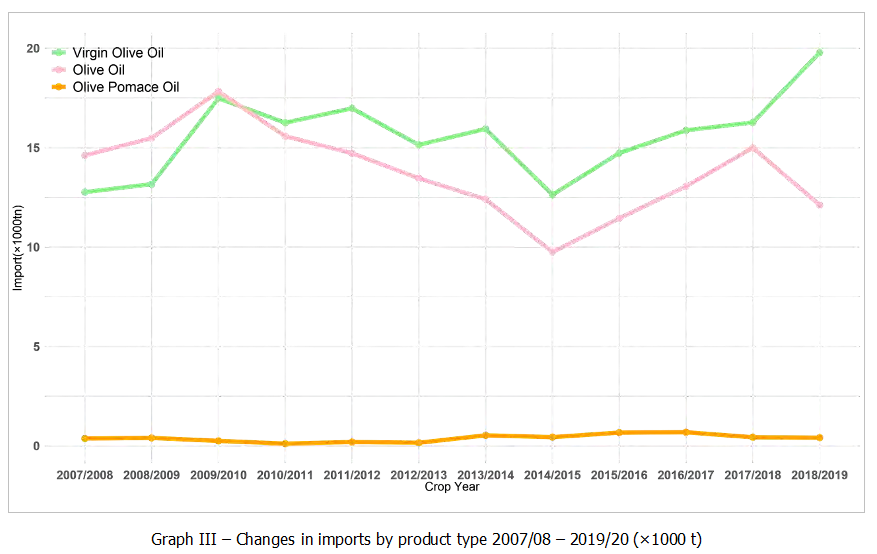
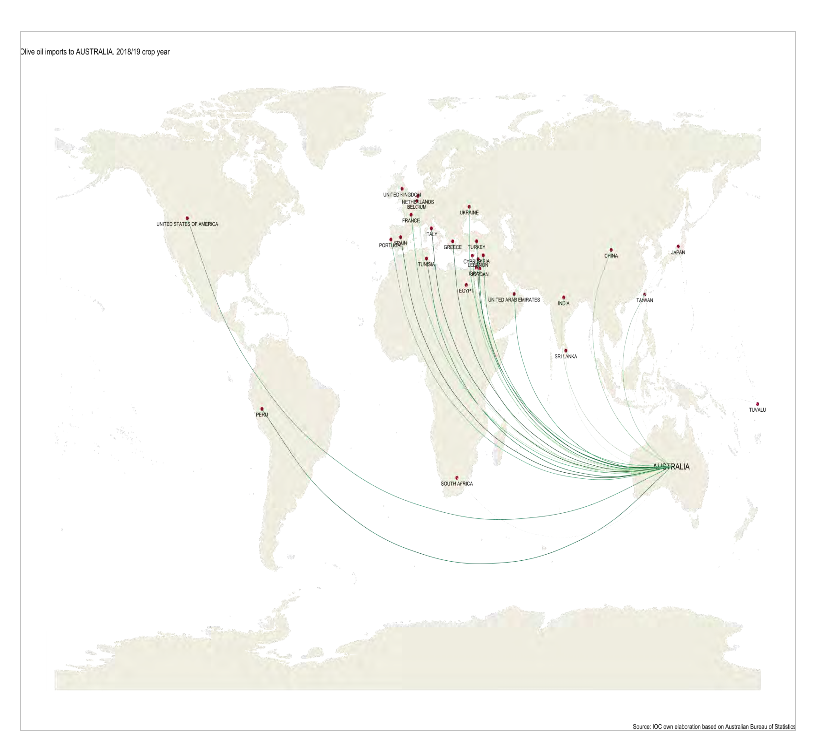
Table olives
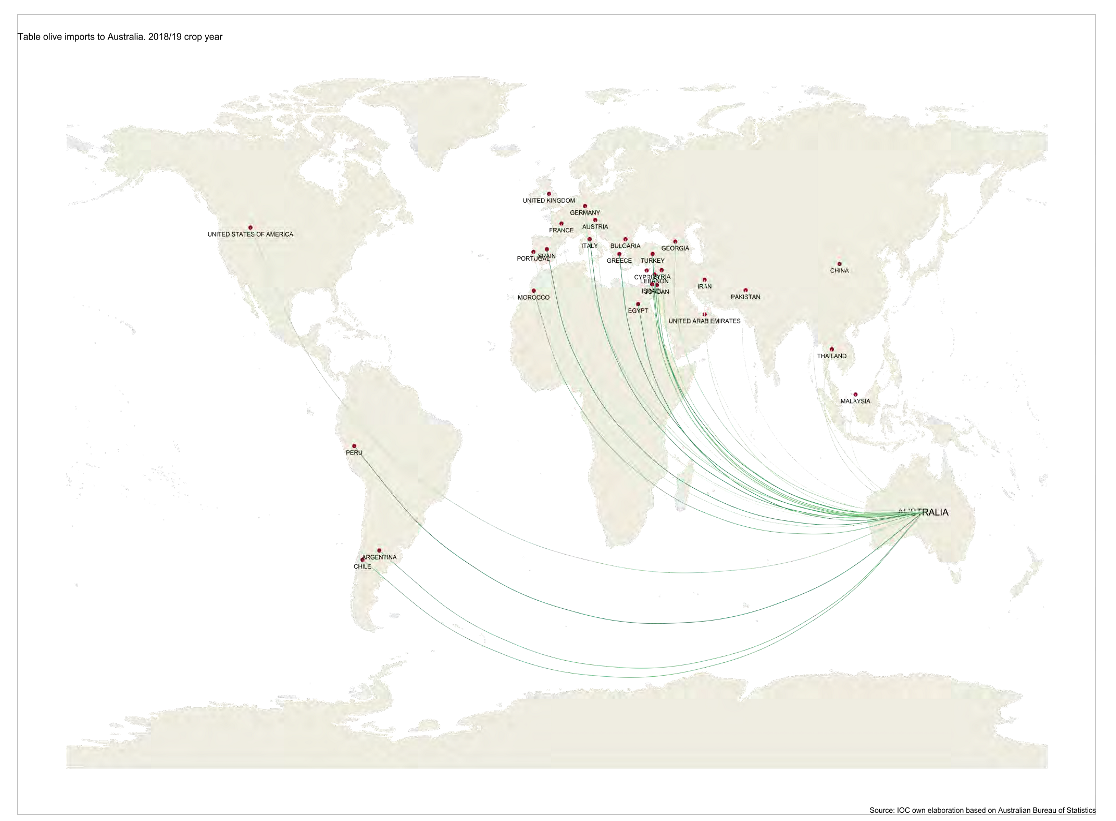
Australian has imported around 17 000 t of table olives in the last 12 crop years, reaching 18 487.7 t in the 2018/19 crop year, or 2.7% of world imports.
Table II shows imports in the last crop year by country of origin. Greece stands out as the main supplier accounting for 53.4% of the volume imported (9 866.3 t), followed by Spain with 31.6% (5 841.1 t); Italy with 6.3% (1 157.9 t); and Turkey with 3.2% (587.5 t). The remaining countries are below 2%.
Section I.2 shows monthly changes in this market.

World trade of olive oil and table olives
Olive oil – 2019/20 Crop year
The table below shows trade figures for olive oil and olive pomace oil in the top eight markets in the first two months of the current crop year (October 2019 – November 2019). Increases were found in China (42%); Brazil (16%); and Russia (2%). Imports fell by 29% in Australia, 9% in the United States, 7% in Japan and 2% in Canada compared to the same period the previous cropyear.
In the first month of the current crop year (2019/20), intra-EU acquisitions rose by 21% and extra-EU imports by 3% compared to the same period the previous crop year1.
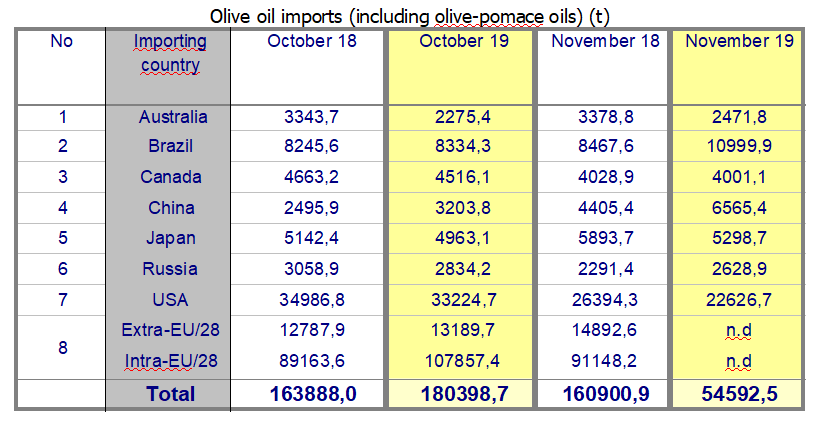
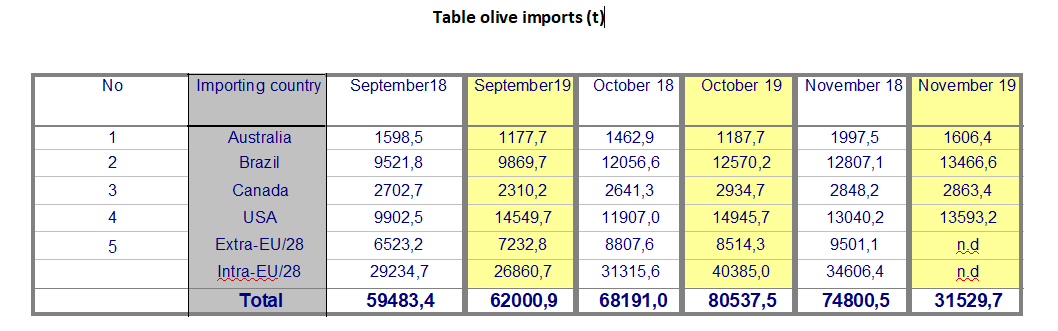
Table olives – 2019/20 Crop year
The table below shows trade in table olives in the 2019/20 crop year (September 2019 – October 2019)2. Increases were found in the US (24%) and Brazil (4%). However, imports fell by 21% in Australia and 1% in Canada.
In the first months of the 2019/20 crop year (September 2019 – October 2019), intra-EU acquisitions rose by 11% and extra-EU imports by 3% compared to the same period the previous crop year3.
_____________________________
1EU data were not available for the month of November 2019 when this newsletter went to print.
2According to the new provisions of the International Agreement on Olive Oil and Table Olives, 2015, which came into force on 1 January 2017, “table olive crop year” means the period of twelve months from 1 September of one year to 31 August of the next.
3EU data were not available for the month of November 2019 when this newsletter went to print.
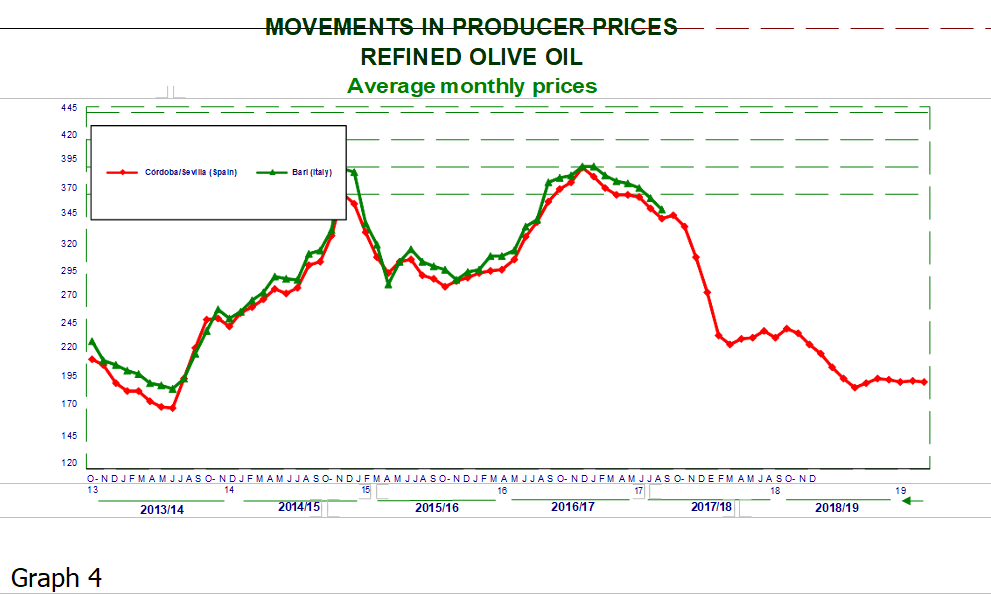
Producer prices – olive oils
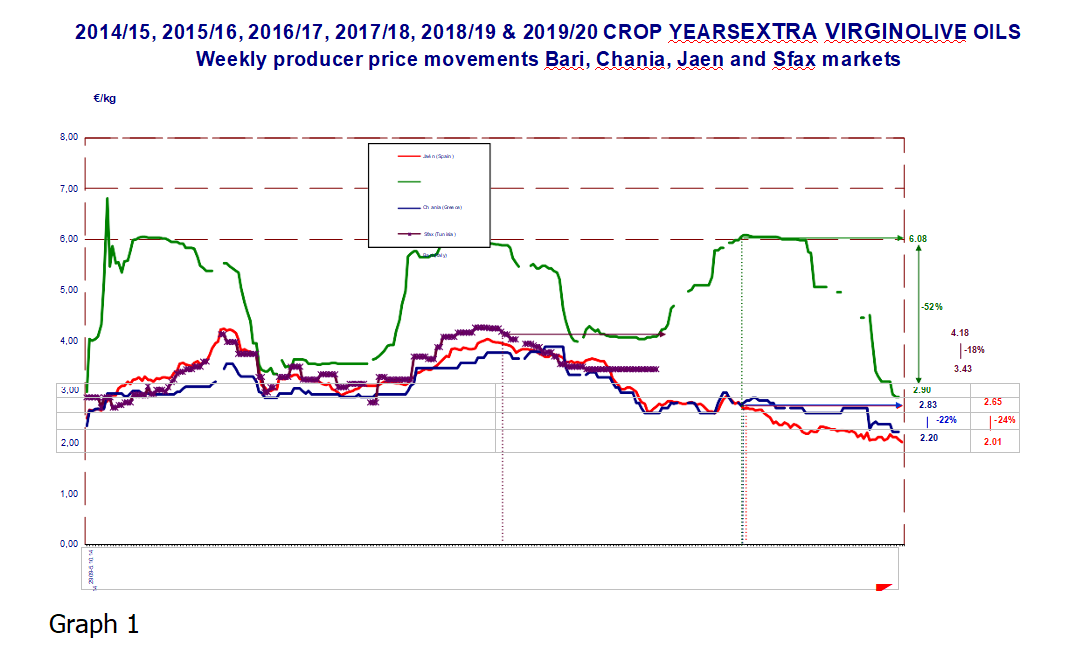
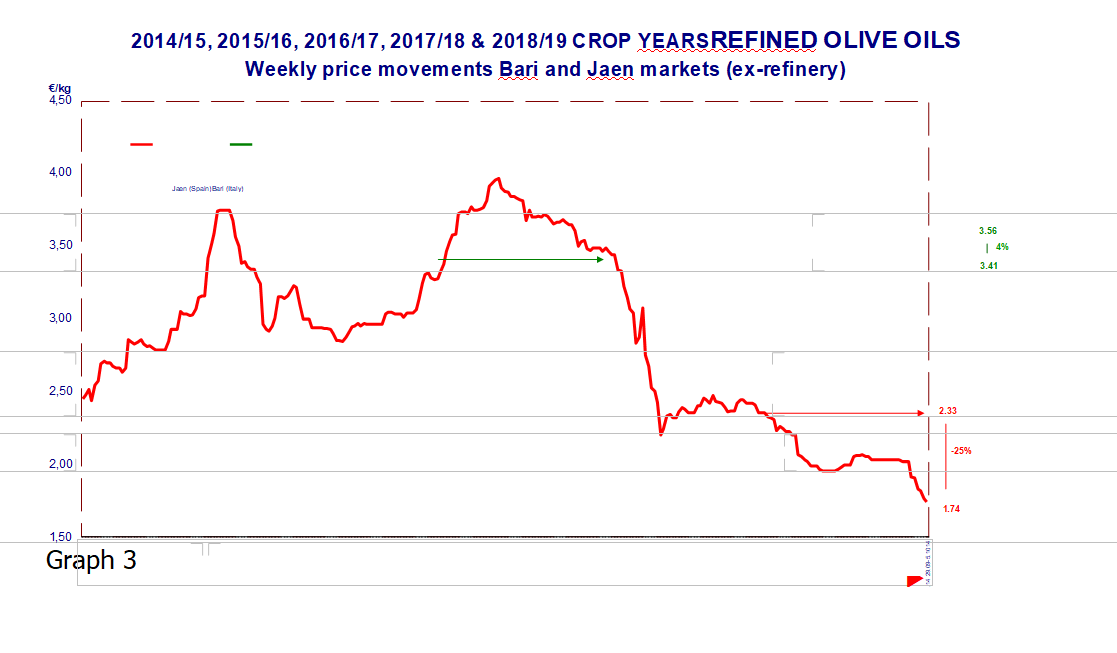
Graph 1 shows the weekly producer price movements of extra virgin olive oil in the top three producer countries of the EU and Tunisia. Graph 3 shows the weekly producer price movements of refined olive oil in the top two producer countries of the EU. Price movements by month can be found in graphs 2 and 4.
Extra virgin olive oil -Producer prices inSpainin the fourth week of January 2020 stood at €2.01/kg, a 24% fall compared to the previous crop year (Graph 1).
Italy -Prices in Italy in the third week of January 2020 stood at €2.90/kg, a 52% fall compared to the previous crop year.
Greece- Prices in Greece in the third week of January 2020 stood at €2.20/kg, down 22% on the previous crop year.
Tunisia -Prices in Tunisia were stable in the last weeks of June 2018, coming in at €3.43/kg, an 18% fall compared to the previous crop year.
Refined olive oil: Producer prices in Spain stood at €1.74/kg in the fourth week of January 2020, which represents a fall of 25% compared to the same period the previous crop year. Data for Italy have not been available since the end of December 2017 when they had increased by 4% to €3.56/kg.
The difference in the fourth week of January 2020 between extra virgin olive oil (€2.01/kg) and refined olive oil (€1.74/kg) in Spain is €0.27/kg. In Italy in December 2017, this difference was €0.43/kg (Graph 3).

To comment you have to register
If you're already registered you can click here to access your account
or click here to create a new account
Comment this news