Imports of Table Olives
The main importers of table olives were the United States (23%), Brazil (17%) and the European Union (16%). Together, these three markets account for 56% of world imports. The remaining importer countries represent below 6%
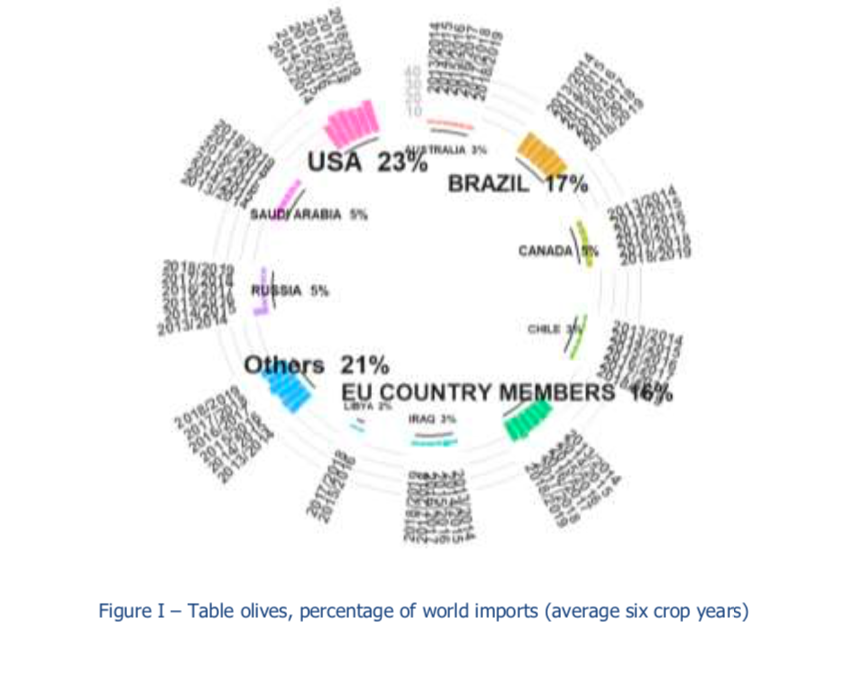
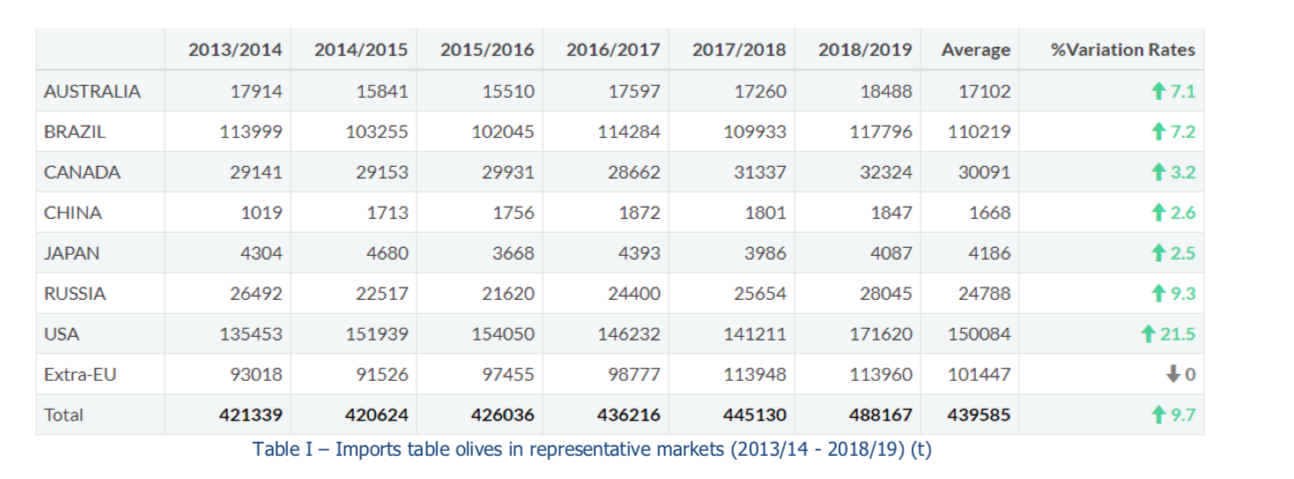
Table 1 shows table olive imports in eight representative markets in the last six crop years. Imports increased significantly in the 2018/19 crop year in all except the European Union, where purchases remained stable. Imports in this crop year grew most in the United States (21.5%) and Russia (9.3%) compared to the previous crop year.
The main suppliers of table olives to these markets are Spain, Argentina, Morocco, Greece, Turkey, Egypt and Peru.
In terms of suppliers, Greece (53%) and Spain (32%) are the main suppliers to Australia; Argentina (54%) and Peru (21%) to Brazil; Spain (57%) and Greece (21%) to Canada; Spain (90%) to China; Spain (61%) and the United States (16%) to Japan; Spain (85%) to Russia; Spain (44%) and Greece (20%) to the United States; and Morocco (43%) and Turkey (32%) to the European Union.
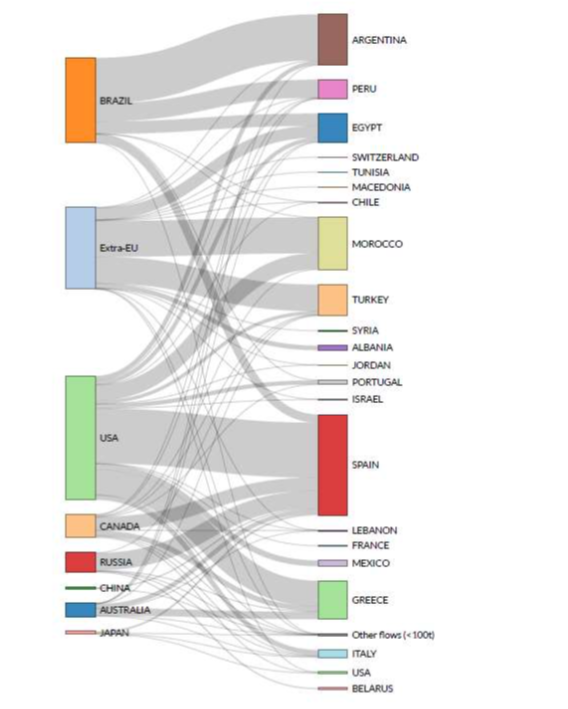
The volume sold by these countries ranges from 26 000 t from Peru to almost 140 000 t from Spain.Figure II – Flow of table olives imports in certain markets (2018/2019)

To comment you have to register
If you're already registered you can click here to access your account
or click here to create a new account
Comment this news