International Olive Council: World market for olive oil anda table olives
1. OLIVE OIL IN THE FIRST SIX MONTHS OF 2014/15
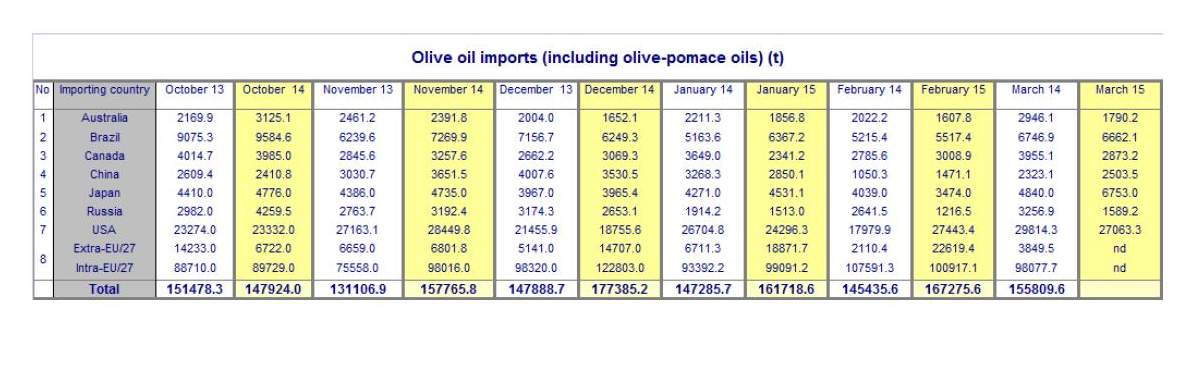
For the first six months of the 2014/15 crop year (October 2014–March 2015), the figures for trade in olive oil under customs heading 15.09 and olive pomace oil under customs heading 15.10 in the countries listed in the table show year-on-year import increases of +9 pc in Japan (there has been a sharp increase in March 2015), +5 pc in Brazil, +2 pc in the United States where the strong import growth in February 2015 made up for the drops in December 2014 and January 2015, and +1 pc in China. In contrast, imports were lower in Russia (−14 pc) owing to a switch of trend as of December 2014, as well as in Australia (−10 pc as of November 2014) and Canada (−7 pc).
The March 2015 data were not available for the EU at the time of publication but the data for the first five months of 2014/15 show an increase of 10 pc in intra-EU acquisitions and 100 pc in extra-EU imports compared with the same period a season earlier. Owing to the hefty drop in output in Spain and Italy, extra-EU imports by both countries soared, particularly imports from Tunisia (+599 pc and +310 pc, respectively) compared with a season earlier. As reported in the previous issue of this newsletter, this upward movement began in December even before the change in the EU regulation on the tariff quota at zero-rate duty, a fact connected with the large climb in Tunisian production in 2014/15.
2. TABLE OLIVES IN THE FIRST SIX MONTHS OF 2014/15
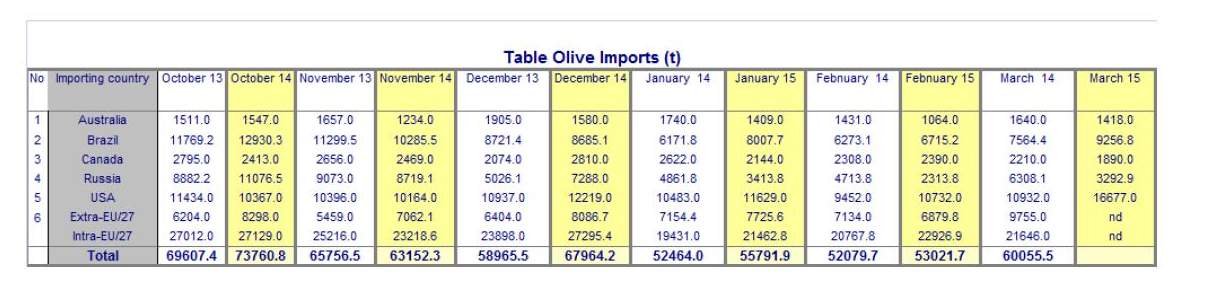
In the first six months of the 2014/15 crop year, i.e. from October 2014 to March 2015, table olive imports (see table below) were higher in the United States (+13 pc) and Brazil (+8 pc) than in the same period a year earlier but moved in the opposite direction in Australia, where they have dropped by 17 pc since November 2014, as well as in Russia (−7 pc since January 2015) and Canada (−4 pc).
At the time of publication, the data for March 2015 were not available for the EU but in the first five months of the 2014/15 season, intra-EU acquisitions increased 5 pc and extra-EU imports rose 18 pc compared with the same period of 2013/14.
PRODUCER PRICES
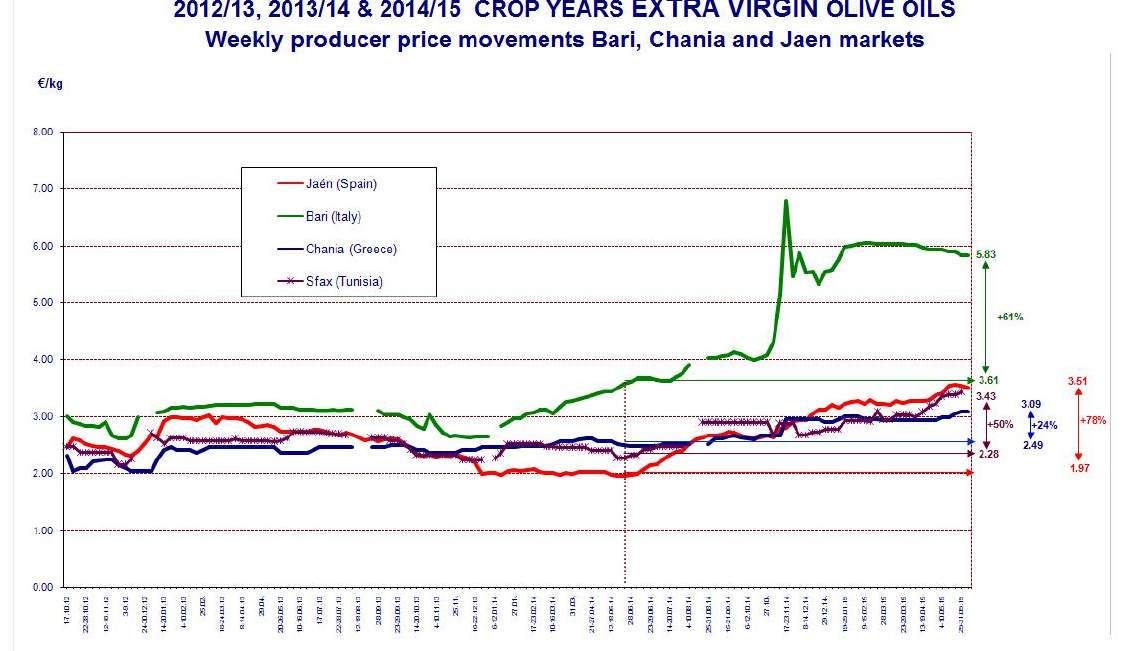
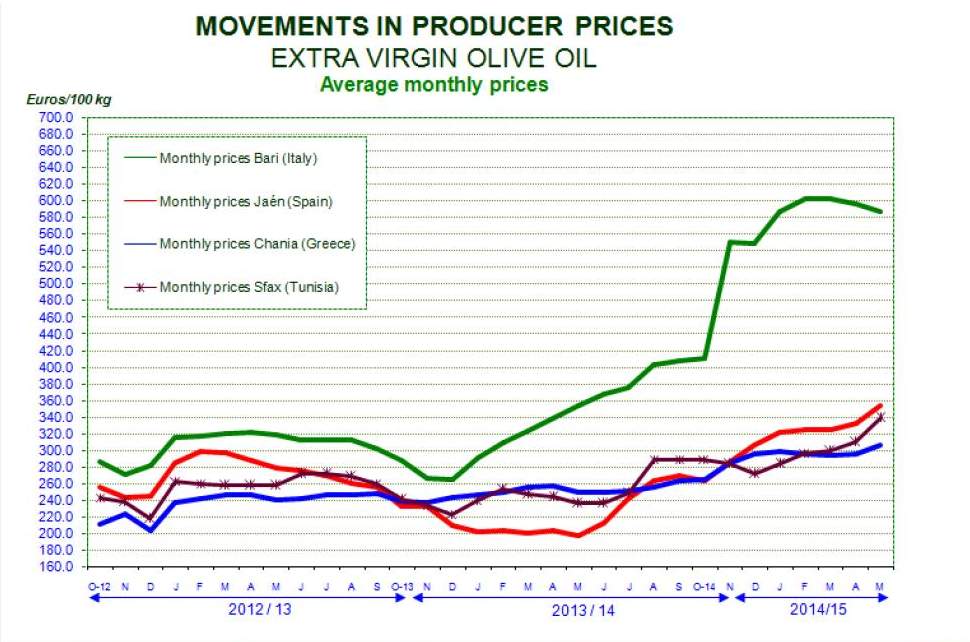
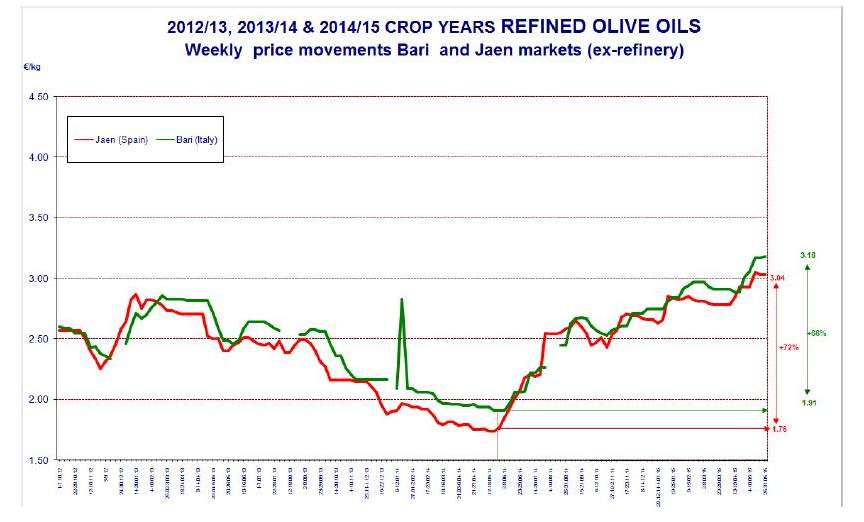
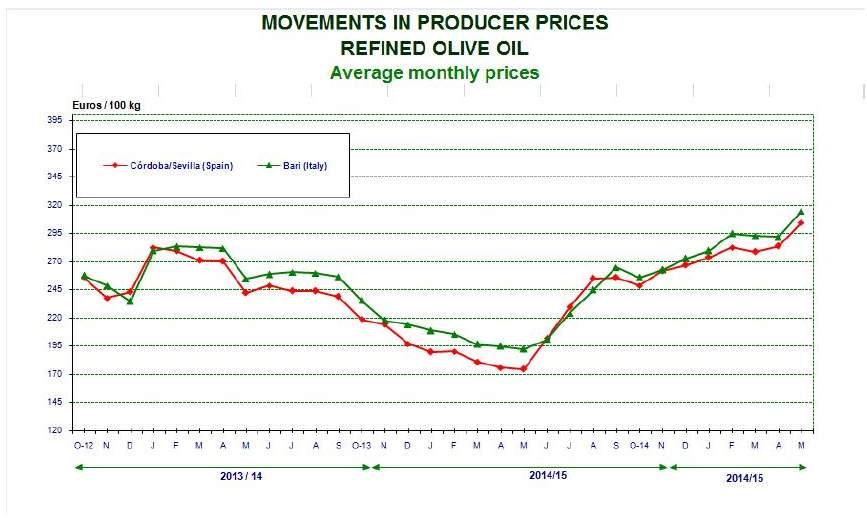
Graph 1 tracks the weekly movements in the prices paid to producers for extra virgin olive oil in the three top EU producing countries plus Tunisia while Graph 3 shows the weekly changes in the producer prices for refined olive oil in the main three EU producers. The monthly price movements for the same two grades of oil are tracked in Graphs 2 and 4.
It is not for the IOC to judge whether these price levels reflect an adequate balance between production costs along the supply chain and the prices that consumers are prepared to pay in their domestic currency to continue consuming olive oil but they are a concern that all the players will no doubt take into account for the long-term sustainable equilibrium and development of the sector.
Extra virgin olive oil
Producer prices in Spain started to rise constantly in the second half of 2014 from the beginning of July onwards. After breaking the three-euro barrier in the second week of December 2014, they continued on their upward trajectory with some minor fluctuations until they reached €3.56 kg in the second week of May 2015, the highest level yet during the period plotted in Graph 1, then dipping to €3.51/kg in the last week of May. This is 78 pc higher than a year earlier and 79 pc above the low recorded in the third week of May 2014 (€1.96/kg).
Italy: In recent months, producer prices in Italy have been on a very clear upward trend. In the week from 10 to 16 November 2014, they hit the highest level of both the period under review and the last decade, reaching €6.79/kg. After decreasing slightly in the second last week of December 2014 prices switched back upwards. After some small dips, they were lying at €5.83/kg at the end of May 2015, i.e. 61 pc higher than a year earlier and 121 pc more than the low recorded in the second week of December 2013 (€2.64/kg). Graph 2 shows how the monthly prices of extra virgin olive oil have behaved in recent crop years.
Greece: Prices have been high in recent months, breaking the three-euro/kg barrier in the third week of January 2015. In the last few weeks they have been inching up to reach €3.09/kg in the last week of May 2015, +24 pc higher than the same period a season earlier.
Tunisia: Towards the end of December 2014, producers were paid €2.73/kg for their extra virgin olive oil. Prices held steady for a while but then started to move upwards in the first week of January 2015. After some small fluctuations, they switched back upwards and peaked at the highest level of the period under review, reaching €3.43/kg at the end of May 2015, equating with period-on-period growth of +50 pc.
Refined olive oil
Producer prices for refined olive oil have hit their highest levels for the period under review.
In Spain they were standing at €3.04/kg at the end of May 2015, up by 72 pc on the same period of the preceding crop year.
In Italy prices stood at €3.18/kg at the end of May 2015, translating into a period-on-period increase of 66 pc. As usual, Italian prices lie above Spanish prices.
No price data are available for this product category in Greece.
At the end of May 2015, the price of refined olive oil (€3.04/kg) and extra virgin olive oil (€3.51/kg ) differed by €0.51/kg in Spain. In Italy, the difference in price between the two categories is considerably wider (€2.55/kg – Graph 3).

To comment you have to register
If you're already registered you can click here to access your account
or click here to create a new account
Comment this news