OLIVE OIL – 2016/17
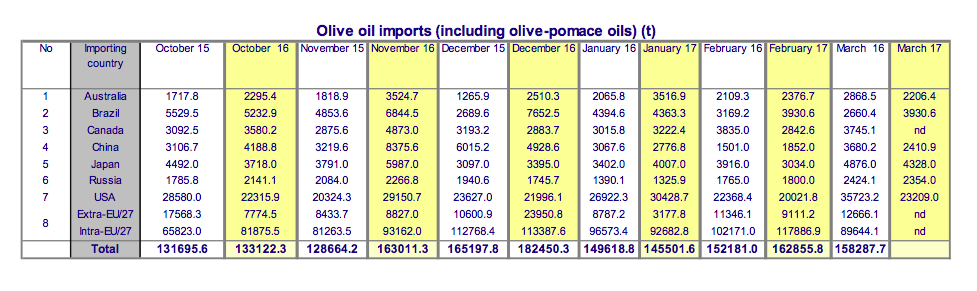
Imports in olive oil and olive-pomace oil in the eight markets listed in the table below, over the first six months (October 2016–March 2017) of the 2016/17 crop year, grew by 39% in Australia; 37% in Brazil; 19% in China; 4% in Japan; and 2% in Russia. In the United States imports fell by 7%, compared to the previous year. At the time of publishing the Newsletter, data for Canada was only available for the month of February 2017, showing a 9% year-on-year increase.
EU1 figures for the first five months of the current crop year (October–February 2017) report that intra- EU acquisitions have risen by 9% and imports from outside the EU have fallen by 7% compared to the same period the previous year.
TABLE OLIVES – 2016/17
Table olive imports in the first seven months of the 2016/17 crop year2 (September 2016–February 2017) in the five markets that appear in the table below, report an increase of 23% in Brazil and 1% in Australia; they however fell in the United States by 3% compared to the previous crop year. At the time of publishing the Newsletter, data for Canada was only available for the month of February 2017, showing a 1% year-on-year decrease.
EU3 figures for the first six months of the 2016/17 crop year (September 2016 – January 2017) reported that intra-EU acquisitions decreased by 3% and that extra-EU imports increased by 4%, compared to the same period the previous crop year.


To comment you have to register
If you're already registered you can click here to access your account
or click here to create a new account
Comment this news