Olive oil. The IOC Council of Members recently held their 24th extraordinary session from 16 to 19 June 2015. During the session, the Economic Committee discussed an agenda including the updated data supplied by the member countries for the 2013/14 and 2014/15 crop years. In this issue of the newsletter we present the provisional data for 2014/15 although they are likely to change between now and November 2015 when they will be definitively approved by member countries. According to the figures available at present, the 2014/15 season opened with 796 000 t in starting stocks. World production is 29 pc down on 2013/14, chiefly because of a 42 pc drop in production in EU countries largely caused by adverse weather conditions. Greece and Cyprus are the only exceptions. Spain has recorded the biggest drop in output versus 2013/14 (−946 500 t or −53 pc) with Italy in next position (−239 200 t or −52 pc) and then Portugal (−30 000 t or −27 pc), France (−3 400 t or −69 pc) and Croatia (−1 800 t or −36 pc). Conversely, production has been higher in Greece (+168 000 t = +127 pc) and Cyprus (+1 000 t = +17 pc). Elsewhere among the IOC membership, production is 16 pc higher in aggregate. The biggest volume increases have been located in Tunisia where production has hit an all-time high of 280 000 t for the second time (the first was in 2003/04) and is 210 000 t higher (+300 pc) than in 2013/14, and in Turkey where it has risen by 25 000 t (+19 pc). The sharpest decreases have been observed in Syria where production has fallen by −115 000 t (−70 pc), and Morocco (−10 000 t or −8 pc). The production figure for Argentina for the 2014 calendar year, which is entered in the world balance for the 2014/15 season, is 24 000 t lower (−80 pc). In 2014/15, the member countries of the IOC have produced 97 pc of the world’s olive oil.
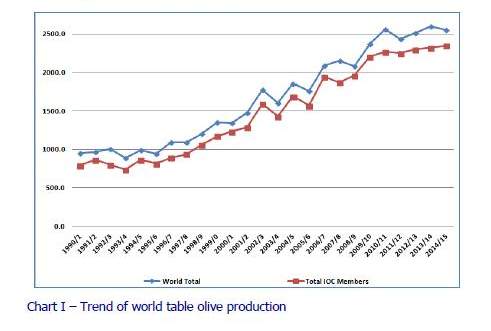
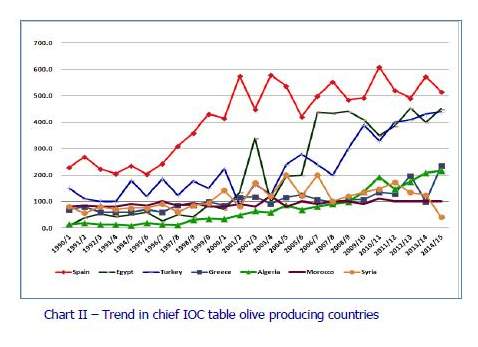
Table olives. The provisional data for 2014/15 assess world table olive production at around 2 553 500 t, down by 2 pc on 2013/14. Chart I shows the trend of world and IOC production. In 2014/15, the Members of the IOC have accounted for 92 pc of the table olives produced in the world. Overall production in the EU is 19 pc higher than the season before. At individual level, Spain has produced 6 pc less than in 2013/14 (538 100 t) while Greece has produced 135 pc more (235 000 t). Output has also been higher in Italy (79 500 = +37.5 pc) but remains unchanged in Portugal (17 500 t). Production in the rest of the IOC Members has fallen by 7 pc as a whole. The steepest decreases have been recorded in Syria, which has produced 40 000 t (−68 pc), and Argentina where it came to 28 000 t in 2014 (−80 pc). Output in Iran (65 500 t) is also down on the season-before level, albeit to a smaller extent (−3 pc). In the opposite direction, production in Egypt (450 000 t) is 13 pc higher. It has reached record levels in Turkey (438 000 t) and Algeria (216 000 t), representing respective increases of 2 and 4 pc. Production in Jordan (40 000 t) is also higher (+11 pc) although the volume involved is smaller. The trend of production in the chief IOC producing countries is shown in Chart II where three countries stand out, particularly Turkey from 2008/09 onwards.
At 2 541 000 t, consumption in 2014/15 is higher than the season before according to the provisional figures while exports (689 500 t) are lower than imports (695 500 t). Import movements for 2014/15 are reported in more detail in section I.2 of this issue.

To comment you have to register
If you're already registered you can click here to access your account
or click here to create a new account
Comment this news