OLIVE OIL AT THE OUTSET OF 2015/16
Comparison of imports of olive oils and olive pomace oils (under customs headings 15.09 and 15.10) in the first three months of the new 2015/16 crop year (October–December 2015) shows period-on-period growth of 29 pc for China (chiefly in December) and 3 pc for the United States. The other markets show large decreases of 43 pc in Brazil, 33 pc in Australia, 16 pc in Japan and 11 pc in Canada. Trade data for Russia were only available for the first two months of the reporting period and show a period-on-period decrease of 48 pc.
The October–November 2015figures for the EU (1) reveal a decrease of 22 pc in intra-EU acquisitions and an increase of 92 pc in extra-EU exports versus the same period of 2014/15.
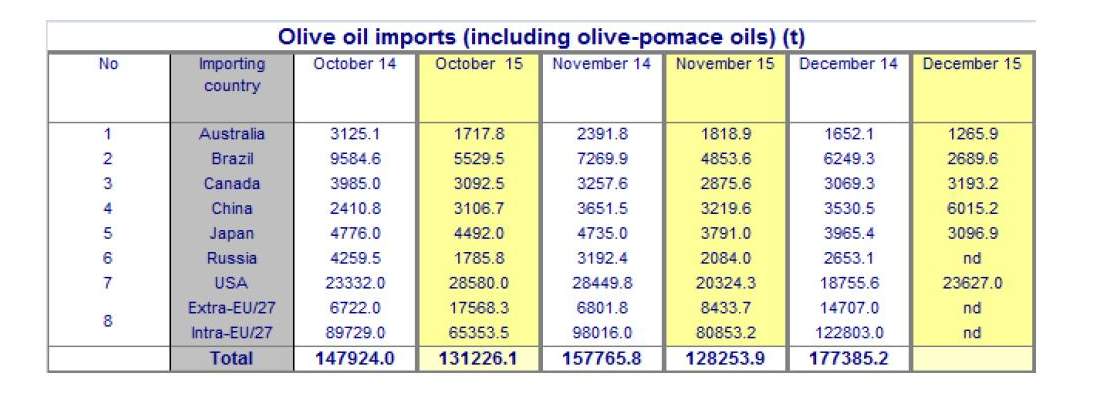
TABLE OLIVES AT THE OUTSET OF 2015/16
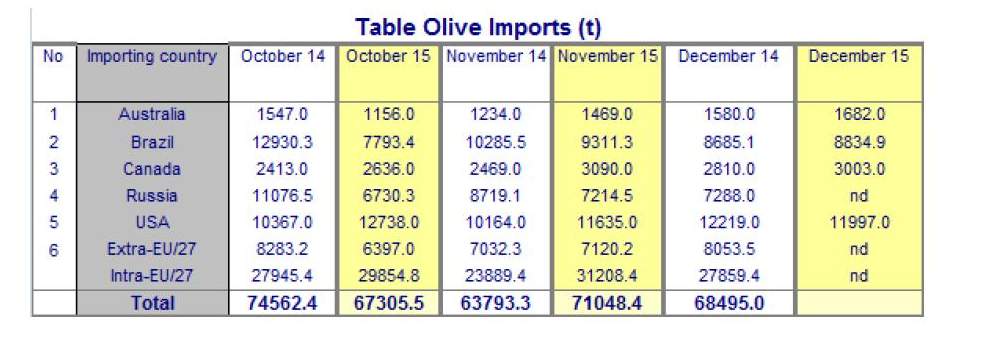
In the first three months of the 2015/16 season (October–December 2015), table olive imports behaved differently in the six markets reported below, showing increases in Canada (+13 pc) and the United States (+11 pc) but decreases in Brazil (−19 pc) and Australia (−1 pc). Only October–November 2015 data were available for Russia and point to a decrease of 30 pc on the same month of the previous season.
EU (1) trade data for the first two months of the new crop year (October and November 2015) report an 18 pc rise in intra-EU acquisitions, contrasting with a 12 pc decrease in extra-EU imports.
(1) EU data for December were not available at the time of writing

To comment you have to register
If you're already registered you can click here to access your account
or click here to create a new account
Comment this news