1. OLIVE OIL – OPENING OF THE 2016/17 CROP YEAR WITH INCREASED IMPORTS
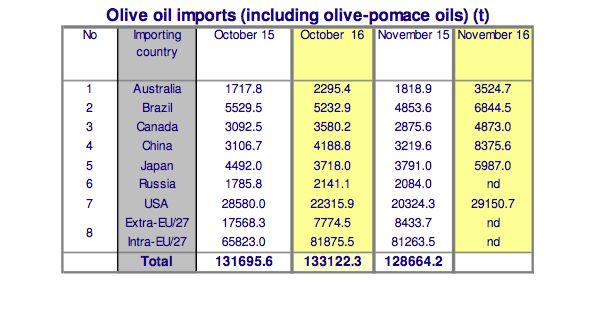
Sales of olive oil and olive pomace oil open the 2016/17 crop year on an upturn. In the first two months (October – November 2016) the eight markets that appear in the table below present an increase of 98.6% in China; 65% in Australia; 42% in Canada; 17% in Japan; 16% in Brazil and 5% in the United States, compared to the same period in the previous campaign.
At the time of publishing this Newsletter, figures for Russia were only available for the month of October, when a 20 % year-on-year increase was recorded.
As regards EU1 trade in the first month of the current crop year (October 2016), intra-EU acquisitions increased by 24% and extra-EU imports fell by 56% compared to the same month the previous year.
2. TABLE OLIVES –2016/17 CROP YEAR OPENING
Trade in table olives in the first three months2 of the 2016/17 crop year (Sept–Nov 2016) in the five markets that appear in the table below show a year-on-year increase of 21 % in Australia; 19 % in Brazil and 4 % in the United States. Imports to Canada, on the other hand, fell by 5%.
In the first two months of the 2016/17 crop year (September–October 2016) EU data3 for table olives showed a 4% decrease in intra-EU acquisitions and a 9% increase in extra-EU imports compared to the same period the previous year.

II. PRODUCER PRICES – OLIVE OIL
Graph 1 tracks the weekly movements in the prices paid to producers for extra virgin oil in the three top EU producing countries and in Tunisia, while graph 3 shows the weekly changes in the producer prices for refined olive oil in the three main EU producers. The monthly price movements for the same two grades of oil are given in Graphs 2 and 4.
Extra virgin olive oil – Producer prices in Spain over the last few weeks increased steadily to reach €3.64/kg at the end of January 2017, which was an 10% increase compared to the same period the previous year. If we compare this price with the maximum price in the third week of August 2015 (€4.23/kg), it presents a 14% decrease (Graph 1).
Italy – Producer prices in Italy began rising in mid-August, speeding up in the first week of November, when they broke the €5 barrier, and coming in at €5.90/kg at the end of January 2017, for a 70% year-on-year increase. Graph 2 shows the trend in monthly prices for the extra virgin olive oil category in recent campaigns.
Greece – The prices in Greece from mid-August to the end of October remained stable but, as in other markets, they then increased at the end of January 2017 to reach €3.46/kg at the end of January 2017, which is a 17% increase compared to the same period the previous year.
Tunisia – Prices in Tunisia, following some weeks of relative stability, increase as of the third week of January, coming in at €3.88/kg at the end of January 2017 for a 18% year-on-year increase.


Refined olive oil: The producer prices for refined olive oil in Spain and Italy generally follow the same trend as the prices for extra virgin olive oil. In Spain, they came in at €3.54/kg, which was a 11% increase on the same period the previous year and in Italy they came in at €3.62/kg, at the end of January 2017, which was a 15% year- on-year increase. No price data are available for this product in Greece.
At the end of January 2017, the price difference in Spain between refined olive oil (€3.54/kg) and extra virgin oil (€3.64/kg) was of €0.10/kg. In Italy the price difference between the two categories was greater at €2.28/kg (Graph 3).


To comment you have to register
If you're already registered you can click here to access your account
or click here to create a new account
Comment this news