OLIVE OIL – 2016/17
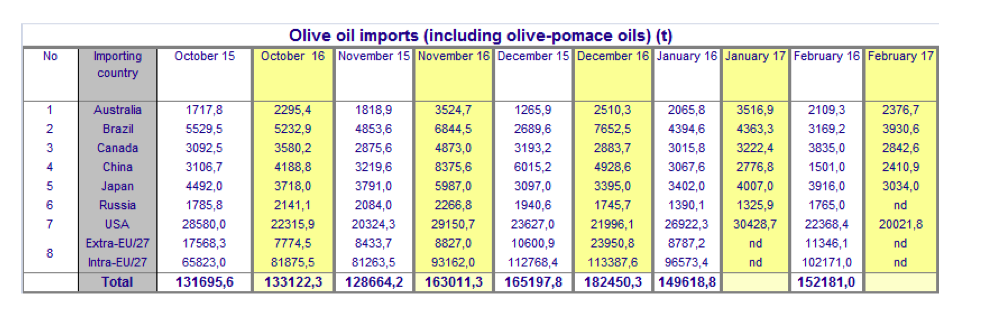
Imports in olive oil and olive pomace oil over the first five months (October 2016–February 2017) of the 2016/17 crop year continue to report strong increases. The eight markets listed in the table below grew by 58% in Australia; 36% in Brazil; 34% in China; 9% in Canada; 8% in Japan; and 2% in the United States, compared to the same period the previous year. At the time of publishing this newsletter, data for Russia were only available for the month of January 2017, showing a 4% year-on-year increase.
EU figures for the first three months of the current crop year (October–December 2016) report that intra-EU acquisitions and imports from outside the EU both rose by 11% compared to the same period of the previous crop year.
OLIVE TABLE – 2016/17
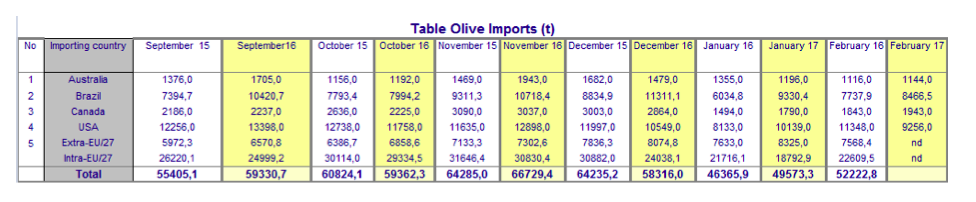
Imports in table olives in the first five months of the 2016/17 crop year2 (September 2016–February 2017) in the five markets that appear in the table below, report an increase of 24% in Brazil; 6% in Australia, and there was no year-on-year change in the United States. Imports however decreased in Canada by 1%.
EU figures for the first five months of the 2016/17 crop year (September 2016 – January 2017) reported that intra-EU acquisitions decreased by 9% and that extra-EU imports increased by 6%, compared to the same period the previous crop year.
PRODUCER PRICES – OLIVE OIL
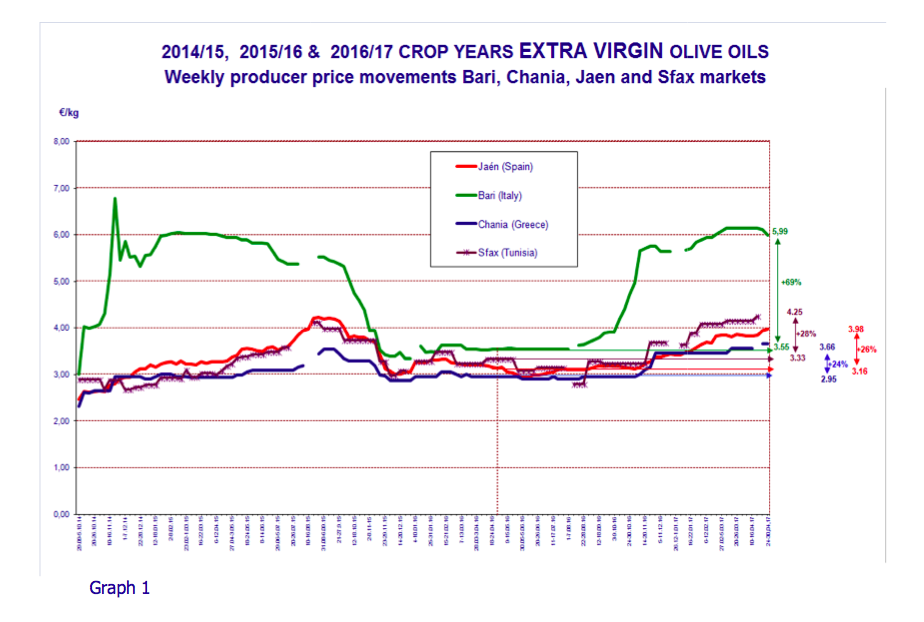
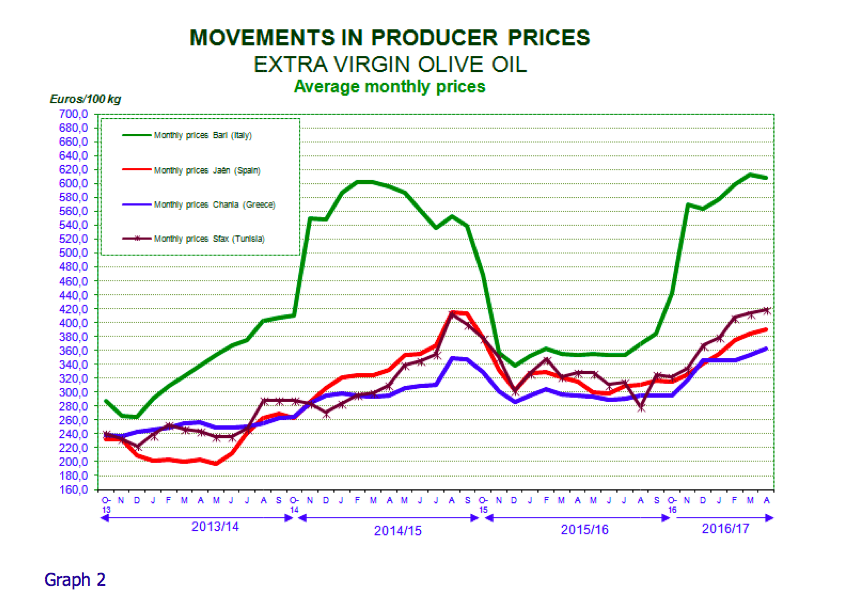
Graph 1 tracks the weekly movements in the prices paid to producers for extra virgin olive oil in the top three EU producing countries and in Tunisia, while graph 3 shows the weekly changes in producer prices for refined olive oil in the three main EU producer countries. The monthly price movements for these categories are given in Graphs 2 and 4.
Extra virgin olive oil – Producer prices in Spain over the last few weeks continued increasing steadily, coming in at €3.98/kg at the end of April 2017, which was a 28% increase compared to the same period the previous year. If we compare this price with the maximum price in the third week of August 2015 (€4.23/kg), it presents a 6% decrease (Graph 1).
Italy – Producer prices in Italy began rising in mid-August 2016; in February 2017 they broke the €6/kg barrier, relenting somewhat in recent weeks and coming in at €5.99/kg at the end of April 2017, which is a 69% year-on-year increase. Graph 2 shows the movements in monthly prices for the extra virgin olive oil category in recent crop years.
Greece – The prices in Greece from mid-August to the end of October remained stable but, as in other markets, they levelled off in November and have remained stable over the last few months, rising slightly as of mid-March and coming in at €3.66/kg at the end of April, which is a 24% increase compared to the same period the previous year.
Tunisia – Prices in Tunisia, following some weeks of relative stability, increased as of the third week of January, breaking the €4 barrier and coming in at €4.25/kg at the end of April 2017 for a 28% year-on-year increase.
Refined olive oil: The producer prices for refined olive oil in Spain and Italy generally follow the same trend as the prices for extra virgin olive oil. The price in Spain at the end of April 2017 stood at €3.91/kg, up by 34% compared to the previous year. In Italy it came in at €3.87/kg, which is a 27% year-on-year increase. No price data are available for this product category in Greece.
At the end of April 2017, the price difference in Spain between refined olive oil (€3.91/kg) and extra virgin oil (€3.98/kg) was of €0.07/kg. In Italy, the price difference between the two categories was greater than in Spain at €2.12/kg (Graph 3).
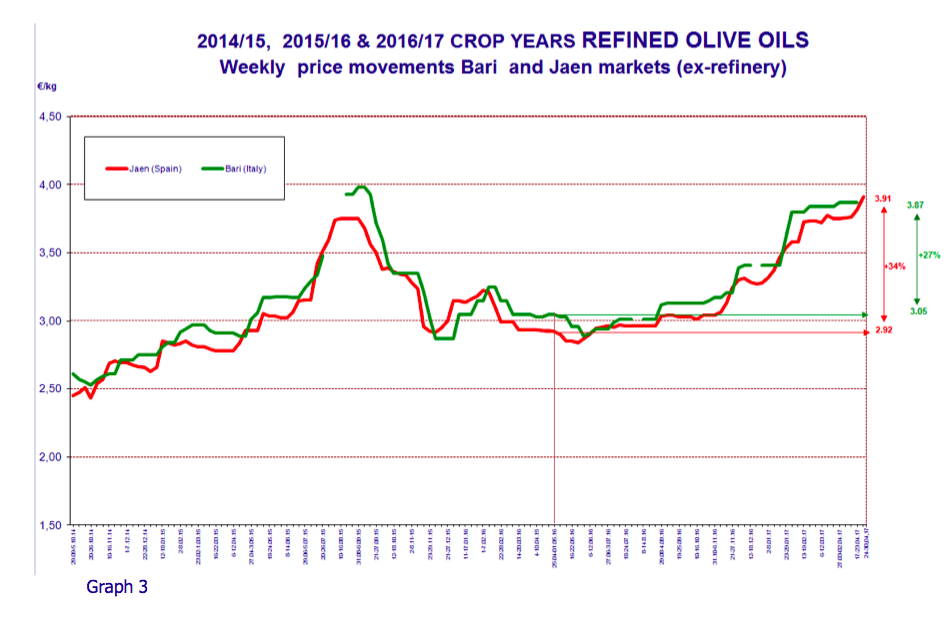
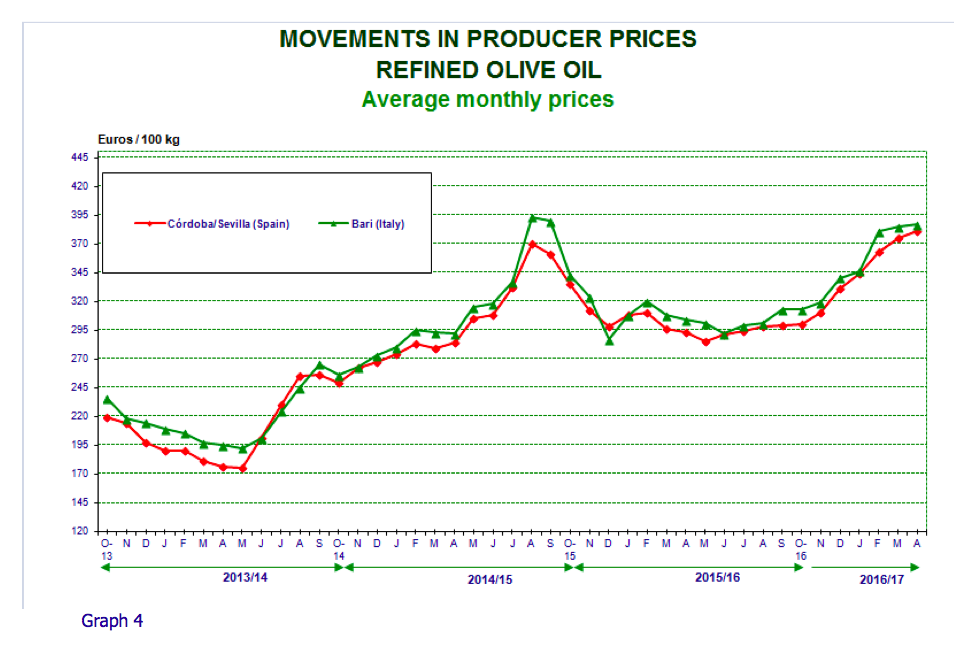
Photo by Olio Officina

To comment you have to register
If you're already registered you can click here to access your account
or click here to create a new account
Comment this news