Oil and table olives in Brazil
The South American country accounts for about 8% of world olive oil imports, ranking third after the United States (36%) and the European Union (15%). These three countries, just to give you an idea, alone account for 59% of world imports. The Brazilian table olive market also shows a positive long-term trend, reaching 17% of world imports.

Olive Oil and Olive Pomace Oil Brazil accounts for about 8% of world olive oil imports and ranks third after the United States with 36% and the European Union with 15%. These three countries alone account for 59% of world imports.
Graph I – Olive oil and olive-pomace oil, percentage of world imports (average of 6 campaigns)
Brazilian imports of olive oil and olive-pomace oil increased by 27.7% to 76,817 tonnes during the last 2017/18 marketing year. Table I shows the evolution of imports during the last 6 marketing years. It should be noted that Portugal, Brazil’s main supplier, is consolidating its leadership position in this market both in absolute and relative values. In this period there is a decrease in the campaign 2015/16, where they reach 50,649 t, representing 32.3% less than in the campaign 2012/13. This decline is attributed to the economic crisis and the devaluation of the Brazilian currency, however, all points in the direction of a significant recovery in imports. In section I.1 of this publication you can follow the evolution of this market monthly.
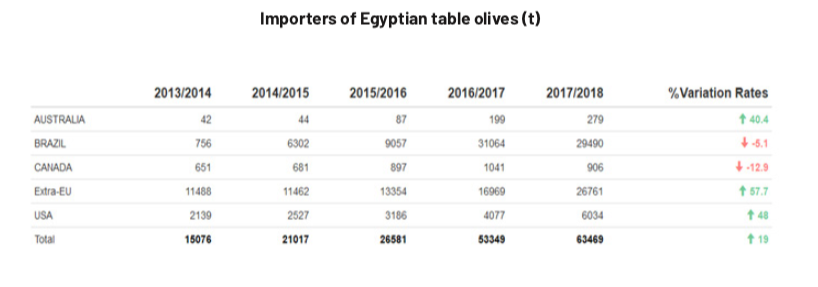
Table I – Imports of olive oil and olive-pomace oil by country of origin (2012/13 – 2017/18) (t)
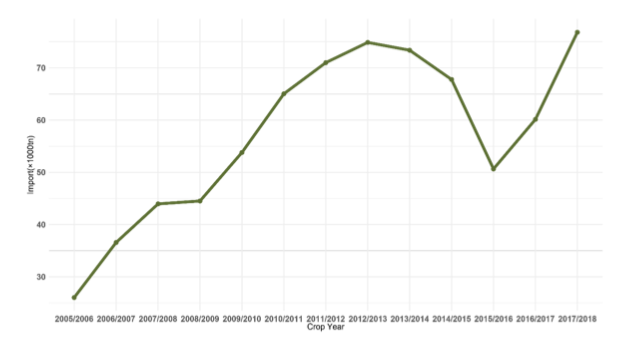
Chart II – Evolution of imports 2005/2006 – 2017/18 (×1000 tonnes)
By origin of imports, 81.3% of the total comes from the European Union, Portugal with 58.8%, followed by Spain with 16.1%, Italy with 5.5% and Greece with 0.8%. The remaining 18.8% comes mainly from Argentina with 9.9%, Chile with 7.4% and Tunisia with 1.2%.
As regards volumes by product category, 85.5% of total imports were classified under code 15.09.10 (virgin olive oils), followed by imports corresponding to code 15.09.90 (olive oils) with 14.0% and the remaining 0.5% corresponds to imports under code 15.10.00 (olive-pomace oils).
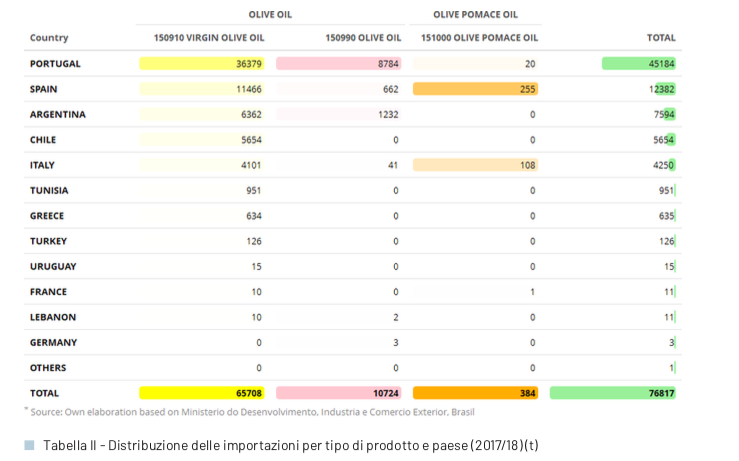
Table II – Distribution of imports by type of product and country (2017/18) (t)
During the last 13 campaigns (Graph III), the evolution of imports by product quality has changed significantly. In the 2006/07 season, imports of virgin olive oil and olive oil were almost equal (48% and 47% respectively) and imports of olive-pomace oil represented 5%. Currently, as already mentioned, 85.5% of the imported oil is classified as virgin and extra virgin olive oil, 14% as olive oil and only 0.5% as olive-pomace oil.
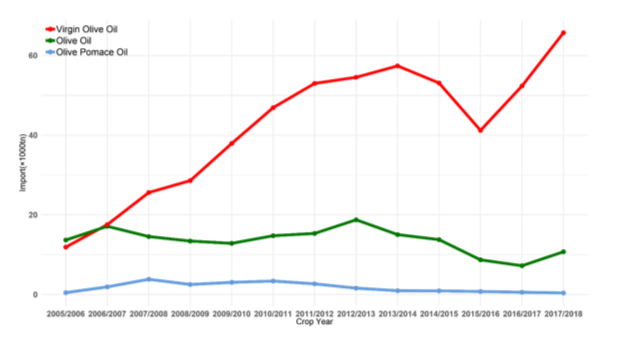
Graph III – Evolution of imports by category of olive oil (× 1000 t)
Table Olives
The Brazilian table olive market shows a positive long-term trend, reaching 109 933.4 tonnes in the last marketing year 2017/18 (September 2017 – August 2018), 17% of world imports, a decrease of 3.5% compared to the previous marketing year. Figure IV shows the trend in imports during the last 13 marketing years, which increased by 99.7% from 55 051.7 tonnes in 2005/06 to 109 933.4 tonnes in 2017/18.
Table II shows the imports of the last marketing year by country of origin, Argentina being the main supplier of this market with 58.7% of the volume imported (64 546.3 tonnes); followed by Egypt with 29.5% (29 489.5 tonnes); Peru with 7.4% (8 168.6 tonnes) and Spain with 6.1% (6 687.3 tonnes). In section I.2 of this publication it is possible to follow the evolution of this market on a monthly basis.

To comment you have to register
If you're already registered you can click here to access your account
or click here to create a new account
Comment this news